
Beginner’s Guide to Stock Day Trading
🟦 What is Stock Day Trading?
Stock day trading is the practice of buying and selling stocks within the same trading day — no positions are held overnight. The goal is to take advantage of short-term price movements using real-time analysis and rapid execution.
While day trading can be done with large-cap, mid-cap, or small-cap stocks, many beginners start with small-cap stocks due to their affordability and higher intraday volatility, which offers more trading opportunities with smaller budgets.
🟩 Types of Stock Market Trading
Understanding where day trading fits in is important. Here's how it compares to other trading and investing styles:
🔹 Day Trading
In and out of positions on the same day
Focuses on minute-to-minute or hourly price action
Requires technical analysis and active management
🔸 Intraday Trading
A broader term often used interchangeably with day trading
May involve multiple trades within the day, or just one good setup
No overnight positions
🟠 Swing Trading
Holding trades for a few days to a few weeks
Focuses on short- to medium-term trends
Less screen time than day trading
🟡 Long-Term Investing
Holding positions for months or years
Based on company fundamentals and economic cycles
Suitable for retirement planning or wealth-building
TABLE OF CONTENT
TYPE OF STOCKS
Large-Cap Stocks ($100+, Market Cap >$10B,e.g.,Apple,Tesla,Nvidia)
Large-cap stocks belong to well-established companies with significant institutional investment. While they are less volatile than smaller stocks, they offer liquidity and predictable movements suitable for scalping and short-term trades.
Key Metrics for Large-Cap Stocks:
Volume: Consistently high, allowing for easy entry and exit.
Relative Volume (RV): Important for detecting unusual institutional activity.
Float: Typically large, reducing sharp price swings.
Volatility: Lower than small caps, making risk more manageable.
Fundamentals: Earnings, revenue growth, and financial stability significantly impact price movements.
News Impact: Economic data, earnings reports, and company events can drive short-term price action.
Mid-Cap Stocks ($10-100, Market Cap $2B-$10B,e.g.,Roku,DrartKings)
Mid-cap stocks strike a balance between volatility and stability. They are liquid enough for day trading but can experience larger price swings than large caps.
Key Metrics for Mid-Cap Stocks:
Volume & Liquidity: Sufficient for efficient trading but lower than large caps.
Float: Moderate, leading to steadier price action compared to small caps.
Fundamentals: Important, but momentum and technical setups also play a role.
News Impact: Earnings reports and sector trends influence movements.
Volatility: Greater than large caps, offering more opportunities for traders.
Small-Cap Stocks ($1-20, Market Cap <$2B)
Small-cap stocks are the primary focus for many day traders due to their high volatility and potential for significant percentage gains within a single session. These stocks are more sensitive to momentum and speculative interest rather than fundamentals.
Key Metrics for Small-Cap Stocks:
Float (<20M Shares): Low float stocks experience sharper price movements due to supply and demand imbalances. Stocks with extremely low floats (under 5M shares) can move erratically, sometimes surging hundreds of percent in a single day - creating massive profit opportunities for day traders.
Ultimately STOCKS FLOAT represents the tradable shares available(SUPPLY).
Volume:TRADING VOLUME represents LIQUIDITY - the higher the volume, the easier it is to enter and exit positions. This volume ultimately reflects real-time market DEMAND for the stock. A premarket volume of at least 500K+ ensures liquidity.
Relative Volume (RV >5x): Indicates whether a stock is trading with significantly higher volume than usual, increasing the likelihood of strong intraday moves.
Price Range: Most small-cap traders focus on stocks priced between $1-$20 to maximize volatility and gain potential.
Premarket Change (>10%): Stocks that move more than 10% in premarket often continue strong intraday momentum.
News & Catalysts: Earnings releases, FDA approvals, mergers, or sector trends create explosive price action.
Volatility: High daily ranges, allowing traders to capitalize on rapid price changes.
Short Interest: Stocks with high short interest can experience powerful short squeezes, further driving momentum.
Since small-cap stocks are highly speculative, traders rely heavily on price action, volume trends, and technical indicators rather than company fundamentals. Identifying stocks with a combination of high relative volume, low float, and strong premarket movement is key to finding opportunities in this category. Small-cap stocks are particularly attractive for traders with a limited budget, as they provide the potential to generate tangible profits when the right strategy, discipline, and risk management are applied.
Small-cap stocks are the primary focus for many day traders due to their high volatility and potential for significant percentage gains within a single session. These stocks often react strongly to news, momentum, and speculative interest, making them ideal for intraday opportunities.
What also makes small-cap stocks attractive — especially for beginners — is their affordability. Traders with modest starting capital can still participate in high-momentum moves and build experience without needing large investments.
🔹 In short: small caps offer the potential to grow a small account faster — with proper risk management and strategy.
🧱 Main Pillars of Stock Day Trading
✅ 1. Catalysts (News & Events)
Catalysts are the fuel that move stocks. A strong intraday move often begins with a catalyst — such as breaking news, earnings reports, analyst upgrades/downgrades, SEC filings, FDA announcements, or partnerships.
Understanding why a stock is moving helps filter out noise and focus on high-probability setups.
🔹 Example: A small-cap biotech company announces FDA approval — the stock surges 50%+ within hours.
✅ 2. Technical Analysis
Once a catalyst is identified, traders use technical analysis to determine when to enter and exit. This includes:
Support/resistance levels and other Key Levels
Moving averages (EMA 9/20/50/200)
VWAP (Volume-Weighted Average Price)
MACD, RSI, volume spikes
Volume Indicators
Trendlines and breakouts
Tape/Level 2
Chart/Candlesticks Patterns
Other Indicators:Every trader has personal preferences when it comes to indicators. What works well for one trader might not suit another. The key is to choose indicators that fit your style and are part of a proven strategy — something you’ve tested and refined through experience.
Technicals give the “how,” while catalysts give the “why.”
✅ 3. Risk Management
Day trading is fast-paced and risky — managing losses is critical. Key elements include:
Stop-loss levels
Position sizing
Avoiding overtrading
Protecting capital first, profits second
One bad trade shouldn't wipe out five good ones.
✅ 4. Strategy & Repeatability
Having clear entry/exit rules is what separates traders from gamblers. Your strategy should be:
Simple and easy to execute
Tested over time
Adapted to market conditions (e.g., high volatility, earnings season)
Example: Buy when price reclaims VWAP on volume after news catalyst.
✅ 5. Trader Psychology
Discipline is the glue that holds it all together. Emotional trading — fear, greed, hesitation — leads to mistakes.
Stick to your plan
Accept small losses
Avoid chasing
Journal trades for growth
The best traders master themselves, not just the charts.
Day traders operate across various stock categories, each with distinct characteristics and metrics to consider.
Key Definitions & Metrics in Stock Day Trading.
1.1 Overall Market Sentiment (Major Indices)
Definition: The general mood of the stock market, influenced by major indices like:
S&P 500 (SPX) – Represents 500 largest U.S. companies.
NASDAQ (NDX) – Tech-heavy index.
Dow Jones (DJIA) – 30 blue-chip industrial stocks.
Russell 2000 – Small-cap index.
Example:
If the S&P 500 is up 2% pre-market, traders may anticipate bullish momentum.
If NASDAQ drops 3% due to tech sell-offs, it signals bearish sentiment for tech stocks.
1.2 News & Catalysts
Definition: Events that impact stock prices.
Examples of Market Catalysts:
Earnings Reports 📊 – A company beating earnings expectations can cause a gap up.
FDA Approvals/Rejections 💊 – Can spike or drop biotech stocks.
Mergers & Acquisitions 🤝 – Stocks involved often gap up.
Federal Reserve Decisions 💵 – Interest rate hikes can drive markets down.
Macroeconomic Data 📉 – Unemployment, inflation, GDP affect overall sentiment.
1.3 Stock Splits & Reverse Splits
Stock Split: A company increases the number of shares while reducing the price per share.
Example: A 2-for-1 stock split means if you own 1 share at $200, you now have 2 shares at $100.
Reverse Split: A company reduces the number of shares while increasing price per share (often to remain above $1 minimum exchange listing).
Example: A 1-for-10 reverse split turns 10 shares at $0.50 into 1 share at $5.
1.4 Dilution
Definition: When a company issues more shares, reducing existing shareholders' value.
Example: A small-cap biotech company raises cash by issuing 10 million new shares, decreasing the stock price.
1. Key Metrics (With Examples & Calculations)
Volume
Definition: Number of shares traded in a specific time frame (1 min, 5 min, daily, etc.).
Example: If a stock has a daily volume of 10 million shares, it means that 10 million shares have exchanged hands throughout the day.
Relative Volume (RVOL)
Definition: Compares current volume to its average volume.
Formula:
RVOL=Current VolumeAverage VolumeRVOL = \frac{\text{Current Volume}}{\text{Average Volume}}RVOL=Average VolumeCurrent Volume
Example:
Stock XYZ has an average volume of 2 million shares per day.
Today, by 10:30 AM, it has already traded 5 million shares.
RVOL = 5M / 2M = 2.5, meaning the stock is trading at 2.5× its normal volume → High activity, strong momentum.
Float
Definition: Number of shares available for public trading (excludes insider-held shares).
Example:
A stock has 50 million outstanding shares, but insiders own 30 million shares.
Public Float = 50M - 30M = 20M shares → Low float, meaning the stock can move quickly.
Float Rotation
Definition: How many times the entire float trades in a given period.
Formula:
Float Rotation=Total Volume TradedFloat\text{Float Rotation} = \frac{\text{Total Volume Traded}}{\text{Float}}Float Rotation=FloatTotal Volume Traded
Example:
Stock ABC has a float of 5 million shares.
Today, total volume is 25 million shares.
Float Rotation = 25M / 5M = 5×, meaning the stock has rotated its entire float 5 times → High potential for big moves.
Example of Pre-market Gap:
Previous Close: $50
Pre-market Open: $55
In this case, the stock gaps up by $5 (10%) from its previous closing price of $50. This could be due to positive news, such as a favorable earnings report or announcement.
Gap Up: The stock opens higher than the previous close.
Gap Down: The stock opens lower than the previous close.
Pre-market gap refers to the difference between a stock's closing price on the previous trading day and its opening price in the pre-market session, before the official market opens.
1-minute ATR – Measures short-term price movement (scalping).
5-minute ATR – Good for intraday volatility assessment.
Daily ATR (ATR 14 on the daily chart) – Used to gauge overall stock volatility.
🔹 Example:
If a stock has a 5-minute ATR of $0.50, it typically moves $0.50 per 5-minute candle.
If the daily ATR is $2.00, it moves an average of $2 per day.
💡 How to Use It?
Use the 5-minute ATR for stop-loss placement and trade entries.
Use the daily ATR to identify high-volatility stocks for day tradin
Gap %
Definition: The percentage difference between the previous close and the current open.
2.5 Bid/Ask Spread & Slippage
Bid Price: Highest price buyers are willing to pay.
Ask Price: Lowest price sellers are willing to accept.
Spread: The difference between bid and ask prices.
Example:
Stock A: Bid = $10.00, Ask = $10.02 → Tight spread (High liquidity).
Stock B: Bid = $10.00, Ask = $10.50 → Wide spread (Low liquidity).
Slippage: When a trade executes at a worse price than expected due to market movement.
2.6 Halt & Short Squeeze
Halt: Trading is paused due to volatility or news.
Example: If a stock rises 10% in 5 minutes, it might be halted by circuit breakers.
Short Squeeze: A rapid price increase forcing short sellers to cover.
Example:
A stock with high short interest (50% of float) suddenly spikes due to news.
Short sellers rush to buy back shares, fueling more buying.Profit/Loss Ratio (P/L Ratio)
Definition: Measures the reward-to-risk ratio for a trade.
Formula:
P/L Ratio=Average Winning TradeAverage Losing TradeP/L \text{ Ratio} = \frac{\text{Average Winning Trade}}{\text{Average Losing Trade}}P/L Ratio=Average Losing TradeAverage Winning Trade
Example:
Average profit per trade: $100
Average loss per trade: $40
P/L Ratio = 100 / 40 = 2.5 → For every $1 risked, $2.50 is gained.
Win Rate %
Definition: Percentage of profitable trades.
Formula:
Win Rate=(Winning TradesTotal Trades)×100\text{Win Rate} = \left(\frac{\text{Winning Trades}}{\text{Total Trades}}\right) \times 100Win Rate=(Total TradesWinning Trades)×100
Example:
Out of 50 trades, 30 were profitable.
(30 / 50) × 100 = 60% → 60% of trades were winners.
2. Key Definitions (With Examples)
Support & Resistance (S&R)
Support: A price level where demand is strong, preventing further decline.
Resistance: A price level where selling pressure prevents further rise.
Example: If a stock bounces off $50 multiple times, that level acts as support. If it struggles to break above $60, that’s resistance.
VWAP (Volume Weighted Average Price)
Definition: A price benchmark weighted by volume, used by institutions.
Example: If VWAP is $25, and the stock is trading above it, traders may consider it bullish.
EMA (Exponential Moving Average)
Definition: A moving average that reacts faster to price changes.
Common EMAs: 9, 20, 50, 200
Example: If a stock is above the 50 EMA, it’s generally in an uptrend.
MACD (Moving Average Convergence Divergence)
Definition: A momentum indicator showing trend strength.
Example:
If MACD line crosses above the signal line, it’s a bullish signal.
If MACD line crosses below the signal line, it’s a bearish signal.
RSI-RSI (Relative Strength Index) is a momentum oscillator used in technical analysis to measure the speed and change of price movements. It ranges from 0 to 100 and helps identify overbought or oversold conditions in a market. Typically, an RSI above 70 indicates overbought conditions, while below 30 indicates oversold conditions.
TYPE OF STOCKS
Large-Cap Stocks ($100+, Market Cap >$10B,e.g.,Apple,Tesla,Nvidia)
Large-cap stocks belong to well-established companies with significant institutional investment. While they are less volatile than smaller stocks, they offer liquidity and predictable movements suitable for scalping and short-term trades.
Key Metrics for Large-Cap Stocks:
Volume: Consistently high, allowing for easy entry and exit.
Relative Volume (RV): Important for detecting unusual institutional activity.
Float: Typically large, reducing sharp price swings.
Volatility: Lower than small caps, making risk more manageable.
Fundamentals: Earnings, revenue growth, and financial stability significantly impact price movements.
News Impact: Economic data, earnings reports, and company events can drive short-term price action.
Mid-Cap Stocks ($10-100, Market Cap $2B-$10B,e.g.,Roku,DrartKings)
Mid-cap stocks strike a balance between volatility and stability. They are liquid enough for day trading but can experience larger price swings than large caps.
Key Metrics for Mid-Cap Stocks:
Volume & Liquidity: Sufficient for efficient trading but lower than large caps.
Float: Moderate, leading to steadier price action compared to small caps.
Fundamentals: Important, but momentum and technical setups also play a role.
News Impact: Earnings reports and sector trends influence movements.
Volatility: Greater than large caps, offering more opportunities for traders.
Small-Cap Stocks ($1-20, Market Cap <$2B)
Small-cap stocks are the primary focus for many day traders due to their high volatility and potential for significant percentage gains within a single session. These stocks are more sensitive to momentum and speculative interest rather than fundamentals.
Key Metrics for Small-Cap Stocks:
Float (<20M Shares): Low float stocks experience sharper price movements due to supply and demand imbalances. Stocks with extremely low floats (under 5M shares) can move erratically, sometimes surging hundreds of percent in a single day - creating massive profit opportunities for day traders.
Ultimately STOCKS FLOAT represents the tradable shares available(SUPPLY).
Volume:Trading volume represents liquidity - the higher the volume, the easier it is to enter and exit positions. This volume ultimately reflects real-time market demand for the stock. A premarket volume of at least 500K+ ensures liquidity.
Relative Volume (RV >5x): Indicates whether a stock is trading with significantly higher volume than usual, increasing the likelihood of strong intraday moves.
Price Range: Most small-cap traders focus on stocks priced between $1-$20 to maximize volatility and gain potential.
Premarket Change (>10%): Stocks that move more than 10% in premarket often continue strong intraday momentum.
News & Catalysts: Earnings releases, FDA approvals, mergers, or sector trends create explosive price action.
Volatility: High daily ranges, allowing traders to capitalize on rapid price changes.
Short Interest: Stocks with high short interest can experience powerful short squeezes, further driving momentum.
Since small-cap stocks are highly speculative, traders rely heavily on price action, volume trends, and technical indicators rather than company fundamentals. Identifying stocks with a combination of high relative volume, low float, and strong premarket movement is key to finding opportunities in this category. Small-cap stocks are particularly attractive for traders with a limited budget, as they provide the potential to generate tangible profits when the right strategy, discipline, and risk management are applied.
Essential Day Trading Concepts (Pre-Strategy Foundation)
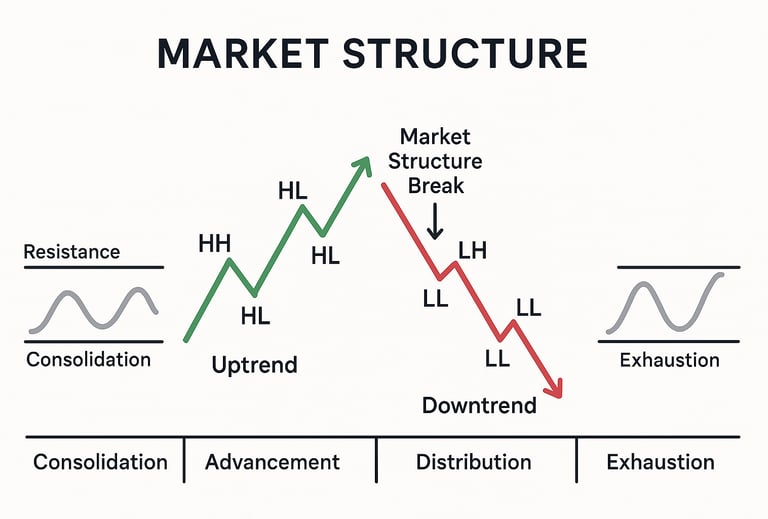
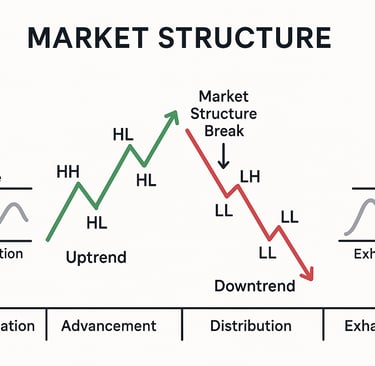
📊 Understanding Market Structure
Market structure is the sequence of price movements that forms the backbone of technical trading. It shows how trends develop, continue, and eventually reverse, making it one of the most powerful concepts in day trading.
🔁 The Three Market Phases:
Uptrend – Price creates higher highs and higher lows
Downtrend – Price forms lower highs and lower lows
Range – Price moves sideways between support and resistance
These phases help traders read momentum and stay on the right side of the move.
⚡️ What is a Market Structure Break (MSB)?
A market structure break happens when the price no longer respects the existing trend structure — for example:
In an uptrend, price fails to make a higher high, then breaks below the last higher low
In a downtrend, price fails to make a lower low, then breaks above the last lower high
This signals that the current trend is weakening or even reversing.
🧩 Why MSB Matters:
Reveals potential trend reversals early
Highlights areas where liquidity grabs and institutional entries often occur
Offers strategic entries with tight risk and high reward
By identifying a structure break, you get a first-mover advantage — entering trades when the majority are still holding the old trend bias.
Using market structure in stocks day trading can significantly improve your timing, entry, and exit decisions. Here’s a breakdown of how to apply the concept step-by-step:
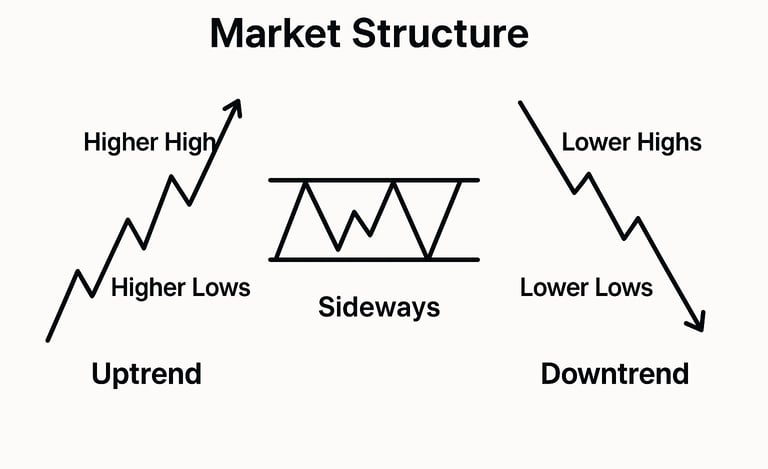
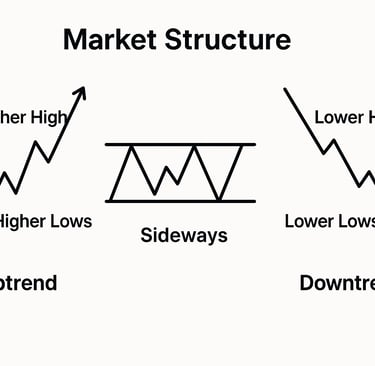
🔍 1. Understand the Basic Market Structure
Market structure refers to the sequence of highs and lows in price action. It helps you identify the trend and potential reversals:
Higher Highs + Higher Lows = Uptrend
Lower Highs + Lower Lows = Downtrend
Equal Highs + Equal Lows / Range-bound = Consolidation
🧠 2. Identify the Current Trend on Higher Timeframe
Even if you're trading on the 1-minute chart, always start with the 5 or 15-minute chart (or even the 1-hour chart before the market opens):
Draw support & resistance levels.
Look for breaks of structure (BoS) and change of character (ChoCH).
Example: If the 5-min chart has been making higher highs, stay bullish until a lower high and lower low break that structure.
📉 3. Use Break of Structure (BoS) and Change of Character (ChoCH)
Break of Structure (BoS): Confirms trend continuation.
→ E.g., price breaks the previous high with volume = potential continuation.Change of Character (ChoCH): Signals a trend reversal.
→ E.g., after higher highs, price fails to make a new high and breaks below the last higher low.
🔑 4. Use It to Define Trade Zones
Once you understand structure:
Identify entry zones near higher lows in uptrend or lower highs in downtrend.
Combine with order blocks, VWAP, EMAs, MACD,RSE,VOLUME,TAPE/LEVEL 2 for confirmation.
✅ 5. Trade Execution (Practical Strategy Example)
Let’s say you’re long-biased on a small-cap stock:
5-min chart shows an uptrend (HHs & HLs).
Wait for a pullback to a demand zone / previous HL.
Look at 1-min chart for a change in micro-structure: e.g., lower lows stop, higher lows begin = entry.
Stop-loss: below recent HL / OB.
Target: recent HH or projected move based on volume & structure.
⚠️AVOID: voi
Entering against structure unless it's a confirmed reversal with volume.
Trading in consolidation/range without breakout confirmation.
ELLIOT WAVE THEORY
What Is Elliott Wave Theory?
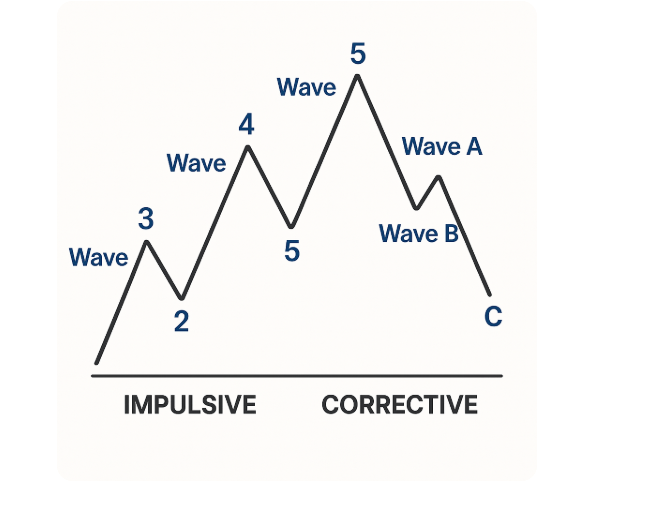
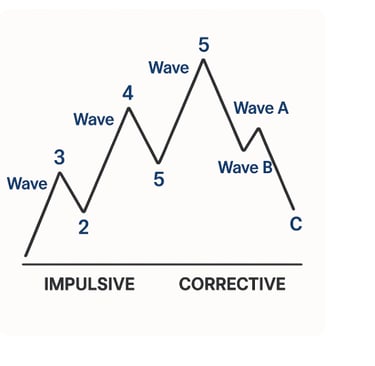
Elliott Wave Theory is a form of technical analysis used to forecast market trends by identifying repetitive wave patterns in price movements.
🔁 Wave Structure Overview (from image):
IMPULSIVE WAVES (Waves 1 to 5):
These waves move in the direction of the main trend.
Wave 1: Start of a new trend—often subtle and not obvious yet.
Wave 2: Minor correction against the trend (can’t retrace beyond start of Wave 1).
Wave 3: Usually the strongest and longest wave, driven by momentum and volume.
Wave 4: Another pullback or consolidation.
Wave 5: Final push of the trend, often with less volume or divergence in indicators.
CORRECTIVE WAVES (Waves A, B, C):
These go against the main trend (a counter-trend correction).
Wave A: Initial reaction to end of trend.
Wave B: Small recovery attempt.
Wave C: Final leg down, completing the correction.
✅ Why It’s Important for Trading:
Identifying Trend and Counter-Trend Moves:
Helps distinguish between trend continuation (1–5) and pullbacks (A–C).
Better Entry and Exit Points:
Traders aim to enter on Wave 2 or 4 retracements and ride Wave 3 or 5.
Helps avoid buying at the end of trends (like Wave 5).
Risk Management:
Provides a structured framework for stop-loss placement and target projection.
Market Psychology Insight:
Each wave reflects investor sentiment, such as optimism, fear, or euphoria.
Using Elliott Wave in Day Trading Stocks:
Spot the Impulsive Waves (1–5) on Lower Timeframes:
On 1–5 min or 5–15 min charts, you can identify short-term micro-trends.
Enter during Wave 2 or Wave 4 pullbacks and ride Wave 3 or 5 for quick profits.
Combine with Volume and Indicators:
Use tools like MACD, RSI, or Volume to confirm if Wave 3 has momentum or Wave 5 shows divergence.
Avoid Traps During Corrective Waves (A–C):
Don’t buy too early after Wave 5 — the A-B-C correction can wipe out gains.
Use Wave C for potential short opportunities if trend reverses.
Scalping or Momentum Trading:
Wave 3 is perfect for momentum-based entries.
Wave 5 can offer final breakout scalps, especially if supported by news or volume surge.
🔑 Summary for Day Traders:
Wave 3 = your best friend 🚀
Wave 2/4 = low-risk entry zones 🎯
Wave C = potential reversal or short ⚠️
SUPPORT & RESISTANCE
FLOOR
CEILING
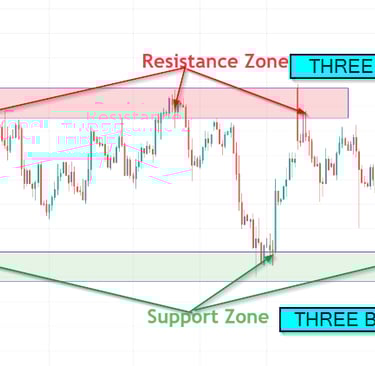
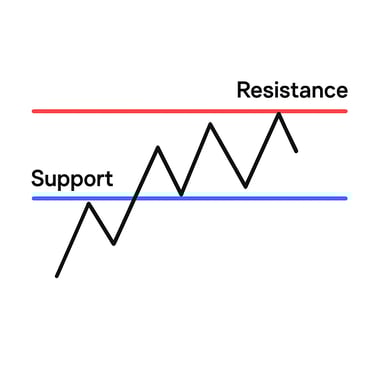
Support & Resistance Zones –More Realistic
Description:
This chart shows a more realistic view of Support and Resistance by highlighting zones instead of exact lines.
These zones account for price wicks, volatility, and institutional order flow.
Price may enter the zone, bounce within it, or slightly overshoot before reversing — all while respecting the level.
Zones are more flexible and reduce false signals caused by minor breakouts or “stop hunts.”
🔥 Why Zones Matter:
Markets are not precise. Institutions place large orders across ranges, not exact prices.
Recognizing S&R as zones rather than strict lines allows traders to:
Wait for confirmation
Avoid premature entries
Set smarter stop-loss placements
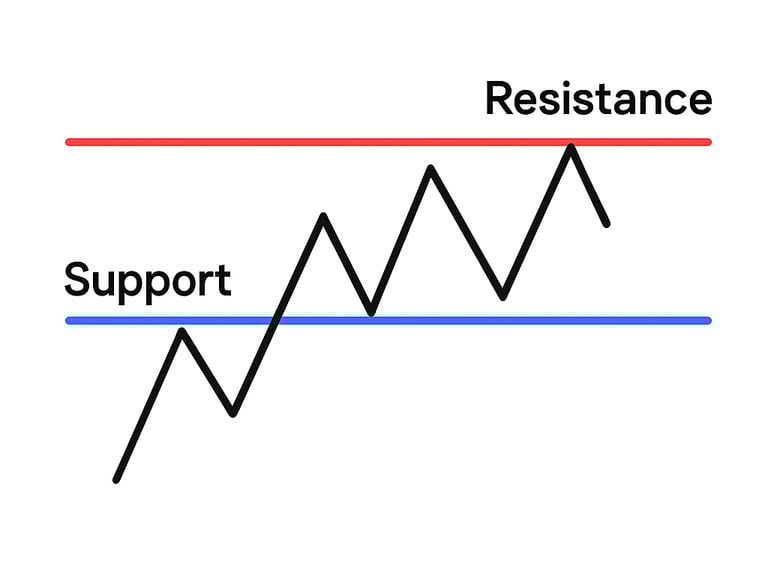
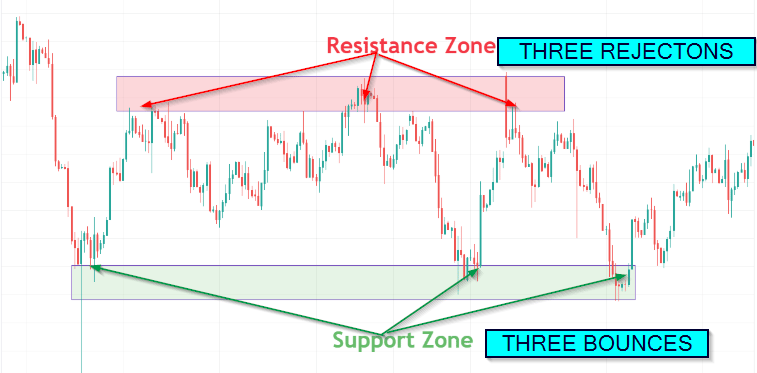
📊 Classic Support & Resistance (S&R)
Description:
This chart illustrates the classic approach to Support and Resistance using clean horizontal lines.
Support is where price finds a “floor” and bounces upward.
Resistance is where price hits a “ceiling” and reverses downward.
Traders often enter or exit trades at these key turning points.
✅ While this style is simple and easy to identify, it assumes price reacts at a precise level — which is rarely true in live markets.