Master Stock Day Trading: Strategies, Scanners & a Solid Plan
Important Note:
While applying a specific strategy is a key part of stock day trading, it’s important to understand that strategy alone is not enough. True success comes from having a well-structured trading plan, consistent execution, and disciplined practice.
Before going live with real capital, make sure to practice extensively in a simulated environment.
This helps you sharpen your skills, test your strategy under different conditions, and build confidence — all while maintaining a strong reward-to-risk ratio and focusing on long-term consistency.
Stocks Day Trading Plan: Why It Matters
Not having a clear trading plan is as dangerous as trying to fly a plane with a broken steering wheel — you're moving fast, but without control. A well-defined plan keeps you focused, consistent, and prepared for both expected and unexpected market behavior.
🧩 Essential Element #1: Set Your Time Frame
Your chosen trading time frame should match your personal rhythm, market experience, and preferred level of activity.
Morning Session (9:30 AM – 11:00 AM ET):
This is the most active window for day traders. It offers high volatility, heavy volume, and liquidity — ideal conditions for fast, clean setups. Many strategies are built around this time because market participants are reacting to overnight news, premarket setups, and opening momentum.Afternoon Session (1:30 PM – 3:30 PM ET):
Volume tends to slow down between 11:00 AM – 1:30 PM (often called the “lunch lull”). But after 1:30 PM, volume often picks up again as traders prepare for the power hour (3:00 – 4:00 PM). Moves in this session can be less predictable and more influenced by institutional repositioning.After-Hours Trading (4:00 PM – 8:00 PM ET):
While trading is possible in the after-hours market, it comes with increased risk:Lower liquidity
Wider spreads
Higher volatility
News-driven spikes that can trap traders without proper risk control
It’s generally not recommended for beginners to trade during this period without a specific news-based strategy
Essential Element #2: Analyze Market Sentiment
Before placing any trades, it’s crucial to understand the overall market environment. Market sentiment can either support or work against your setups — and being aware of it gives you a major edge.
🔍 Key Tools to Gauge Market Sentiment:
Major Indices – Track the overall market tone:
SPY (S&P 500 ETF): Represents the top 500 large-cap U.S. companies. It reflects broader market health and is a general barometer for investor sentiment.
QQQ (NASDAQ-100 ETF): Focuses on tech-heavy and growth stocks. Useful if you're trading small caps, tech, or biotech.
DIA (Dow Jones ETF): Tracks 30 blue-chip industrial companies. Often slower-moving but helpful for checking the strength of legacy sectors.
IWM (Russell 2000 ETF): Represents small-cap stocks. Crucial for small-cap traders — if IWM is weak, small-cap momentum may be limited.
VIX (Volatility Index):
Known as the “fear index,” the VIX tracks market volatility expectations.
High VIX (>20) = increased uncertainty and choppy price action
Low VIX (<15) = calmer conditions, often smoother trends
Use it to adjust your position sizing or avoid overtrading in extreme conditions.
Sector Performance:
Focus on the sector your stock belongs to. If you're trading a biotech name, and the entire Healthcare or Biotech sector ETF (like XLV or XBI) is trending strongly, your stock has a better chance of following through.
Use heatmaps or sector performance dashboards (available on TradingView, Finviz, or Benzinga) to spot which sectors are hot or cold today.
Major News Events:
Be aware of economic releases (CPI, Fed announcements, job reports) and earnings reports for your stock or its sector peers.
Use an economic calendar and premarket news feed to stay informed.
Sudden news events can override technical setups, so always check the headlines before entering a trade.
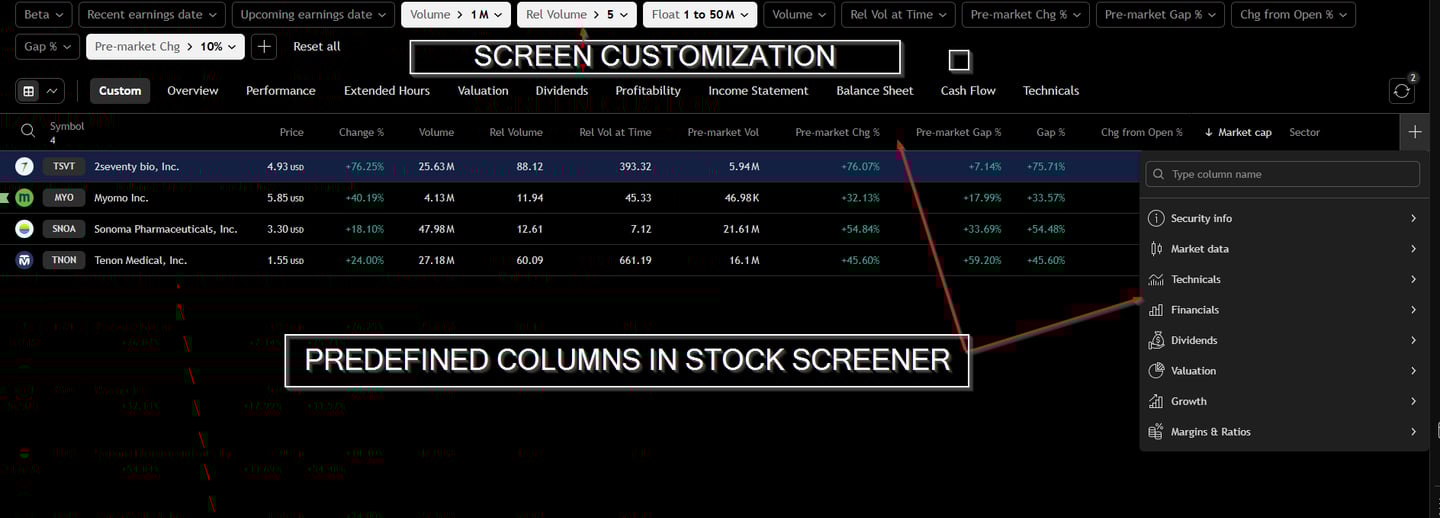
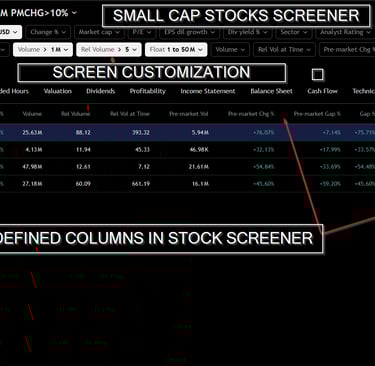
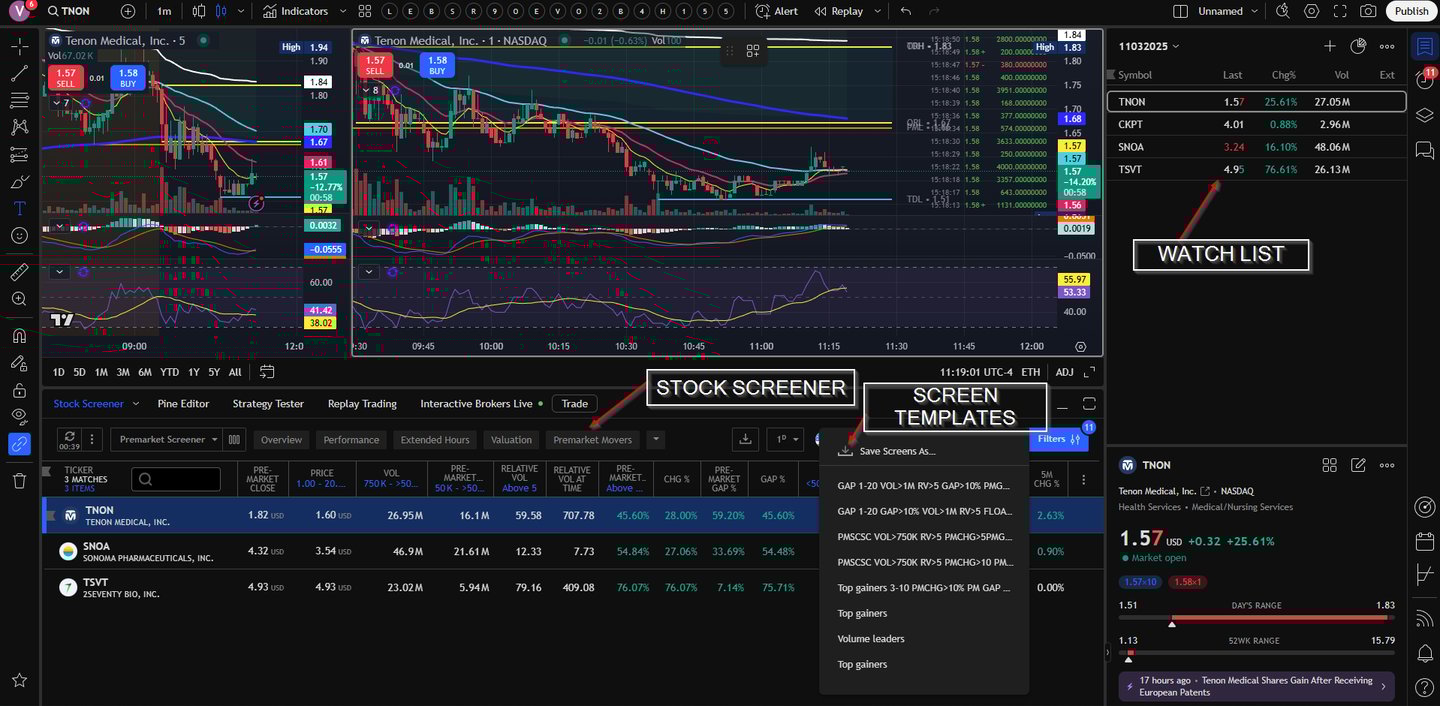
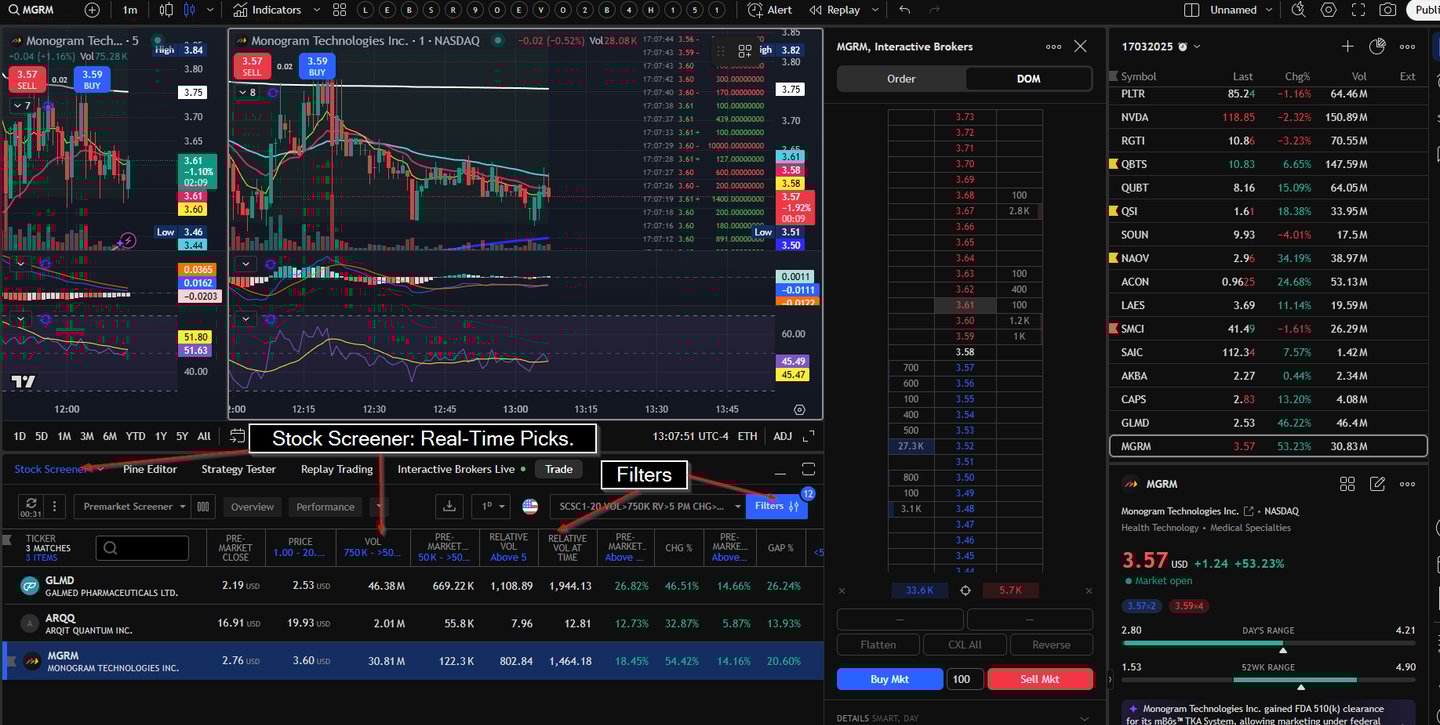
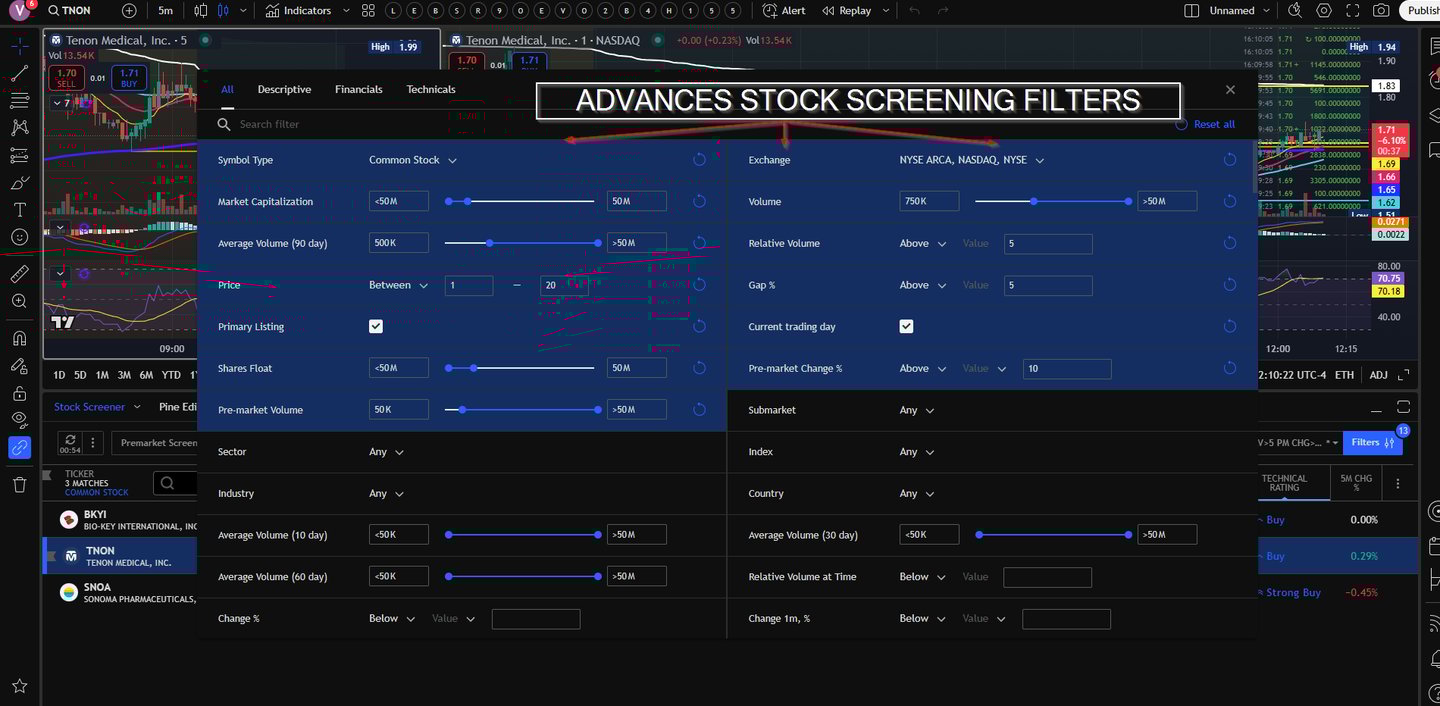
📋 Essential Element #3: Create a Watchlist Using a Stock Scanner
An effective day begins with a sharp watchlist. You don’t need to watch everything — just the right things.
🛠️ Use Scanners on Your Platform:
Most trading platforms offer built-in screeners or scanners to help you filter stocks based on criteria that match your strategy. Here are a few examples:
TradingView – Offers customizable stock screener with filters for price, volume, % change, relative volume, float, and more. For a deeper understanding of this platform, check out our detailed guide here.
Trade Ideas – A powerful scanner built for active day traders with real-time data and pre-set momentum filters.
Benzinga Pro, Scanz, orThinkorswim – Also great tools depending on your needs and budget.
📊 Build Your Initial List Based on Key Filters:
Tailor the filters to your specific strategy and stock type. For example, small-cap momentum traders might scan for:
Price Range: $3 – $20
Float: Under 20M
Volume: Over 500K in premarket / 1M+ after open
Relative Volume (RVOL): >3
% Change: Over 5%
Pre-market Change>10%
Pre-Market Gap>5%
News Catalyst: Earnings, FDA approvals, etc.
This process should give you a list of 5–10 stocks with potential.
🎯 Narrow It Down to Focus:
After building your initial list, analyze the charts, check the level 2, and assess market sentiment. Then narrow your focus to 2–3 stocks that show:
Clean technical setup
Strong volume and range
Favorable price action (e.g. above VWAP, trending with EMAs)
Clear risk/reward opportunity
Monitor News
Focusing on a few top setups keeps your attention sharp and reduces emotional trading.
🧱 Essential Element #4: Conduct Top-Down Analysis to Define Key Levels
Once you've selected your 2–3 focus stocks, it's time to analyze them in context. This step is all about identifying the key levels where smart money is likely to act — buying, selling, or trapping traders.
🧭 Top-Down Approach: From Higher Time Frame to Execution Chart
Start with Daily (1D) and Hourly (1H) Charts:
These timeframes are crucial for stock day trading. Large institutions, funds, and experienced traders rely on these levels — so you should too.
Look for:Support & Resistance zones
Trend direction (higher highs/lows vs lower highs/lows)
Volume at price areas where interest accumulates
Draw Trend Lines as Dynamic Support/Resistance
🧩 Draw the Most Relevant Key Levels:
YEC (Yesterday’s Close)
PMH (Premarket High)
YDH (Yesterday’s High) and YDL (Yesterday’s Low)
YEL (Yesterday’s Extended Hours Low) if applicable
52-Week High/Low – Crucial for breakout or breakdown potential
Analyst Ratings – Pay attention to upgrades/downgrades or price target changes
Forecast Zones – Areas of projected move based on measured moves, breakout range, etc.
These levels serve as your decision zones — they help you define entry points, stop loss levels, and profit targets.
📢 Check for News Catalysts:
Company-specific news like earnings, press releases, FDA decisions
Sector or macroeconomic news that can impact sentiment
Headlines that influence volume spikes or gap moves
🧰 Pro Tip (Using TradingView):
If you're on TradingView, look for the “Key Levels” indicator in the Indicators section. It automatically draws:
Previous highs/lows
Close/open levels
Premarket and after-hours levels
This saves time and ensures you're not missing critical zones.📌 Essential Element #5: Create a Project Plan for Each Stock & Define Strategy
Once you’ve completed your top-down analysis and identified key levels, the next step is to build a clear trade plan for each selected stock. Think of it as a mini project with a well-defined structure and objective.
✅ Set Your Strategy:
Based on the chart setup, volume, and sentiment, decide which type of strategy you’re applying. Examples include:
Breakout Strategy
VWAP Reclaim
Gap and Go
Trend Continuation
Pullback to Support
Choose the one that fits best with current market structure and volume profile.
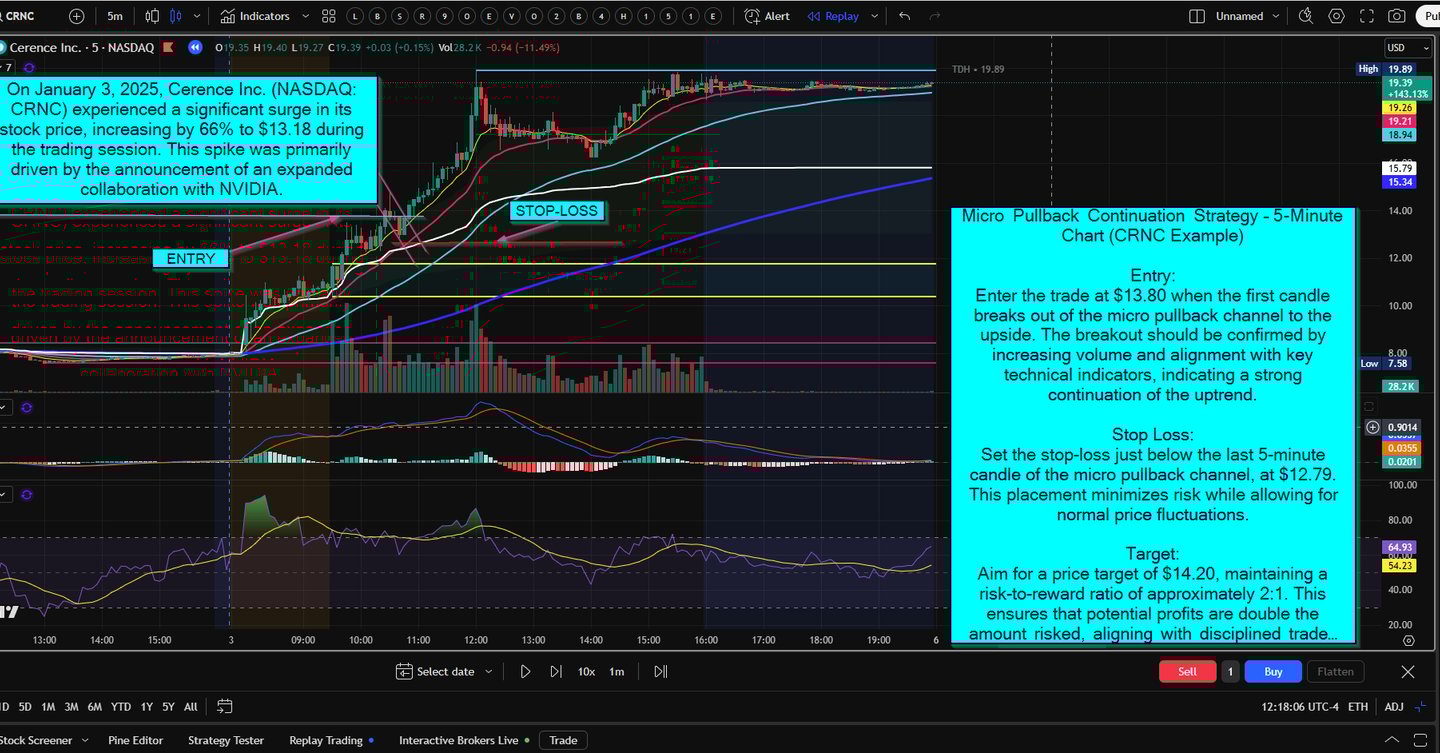
🔧 Define Trade Parameters for Each Stock:
📍Entry Point:
Based on a key technical level (e.g. above PMH, reclaiming VWAP, break of intraday resistance)
Confirmed with volume spike or price action signal (e.g. bullish engulfing, higher low bounce)
⛔ Stop-Loss:
Place just below the nearest strong support (VWAP, EMAs, key level)
Keep it tight but realistic to avoid getting wicked out
Max loss per trade = 1–2% of your account size (or whatever your plan defines)
🎯 Exit Point / Profit Target:
Aim for at least a 2:1 reward-to-risk ratio
Use nearby resistance, whole numbers, or fib extensions for price targets
How to Use Order Types by Trading Session
Knowing which order types are valid or effective during different market phases is critical for successful execution and risk management.
📈 1. Premarket & After-Hours Trading (Extended Hours)
Time:
Premarket: 4:00 AM – 9:30 AM EST
After-Hours: 4:00 PM – 8:00 PM EST
Characteristics:
Lower volume, wider spreads, less liquidity
✅ Allowed/Recommended Order Types:
Limit Orders only — You must specify your price
🕘 2. Regular Market Hours (9:30 AM – 4:00 PM EST)
Best liquidity and volume
✅ Available Order Types:
Market Order:
Instant execution at current price — useful for fast-moving tradesLimit Order:
Specifies exact price — ideal for precision entries or exitsStop Order (a.k.a. Stop Market):
Becomes a market order once the stop price is hitStop-Limit Order:
Becomes a limit order at your set price after the stop is triggered
💡 Example:
Buy Stop @ $5.10 to enter a breakout
Sell Stop @ $4.80 to protect your downside
Stop-Limit @ $4.80 with limit $4.75 for controlled risk
🧠 Tip: Avoid market orders at the open unless necessary — price slippage is common.
💡 Example — $10K Account, 1% Risk Per Trade:
Account Size: $10,000
Risk Per Trade (1%): $100
Stock Price: $5.00
Stop-Loss: $4.80 (stop distance = $0.20)
🔢 Position Size:
$100 ÷ $0.20 = 500 shares🎯 Target Price: $5.40
✅ Profit: 500 shares × $0.40 = $200
📊 Reward-to-Risk Ratio: 2:1This structured approach ensures:
Loss is limited to 1% of your capital
You're targeting twice the risk in potential reward
Repeat this calculation for each trade to maintain consistency and protect your account.
Consider scaling out at the first target and trailing stop the rest if momentum continues
🛎️ Create Key Alerts :
To avoid staring at the screen all day or missing your entries:
Set alerts for:
Entry trigger level
Stop-loss breach
First and second price targets
Volume surge or VWAP cross (optional)
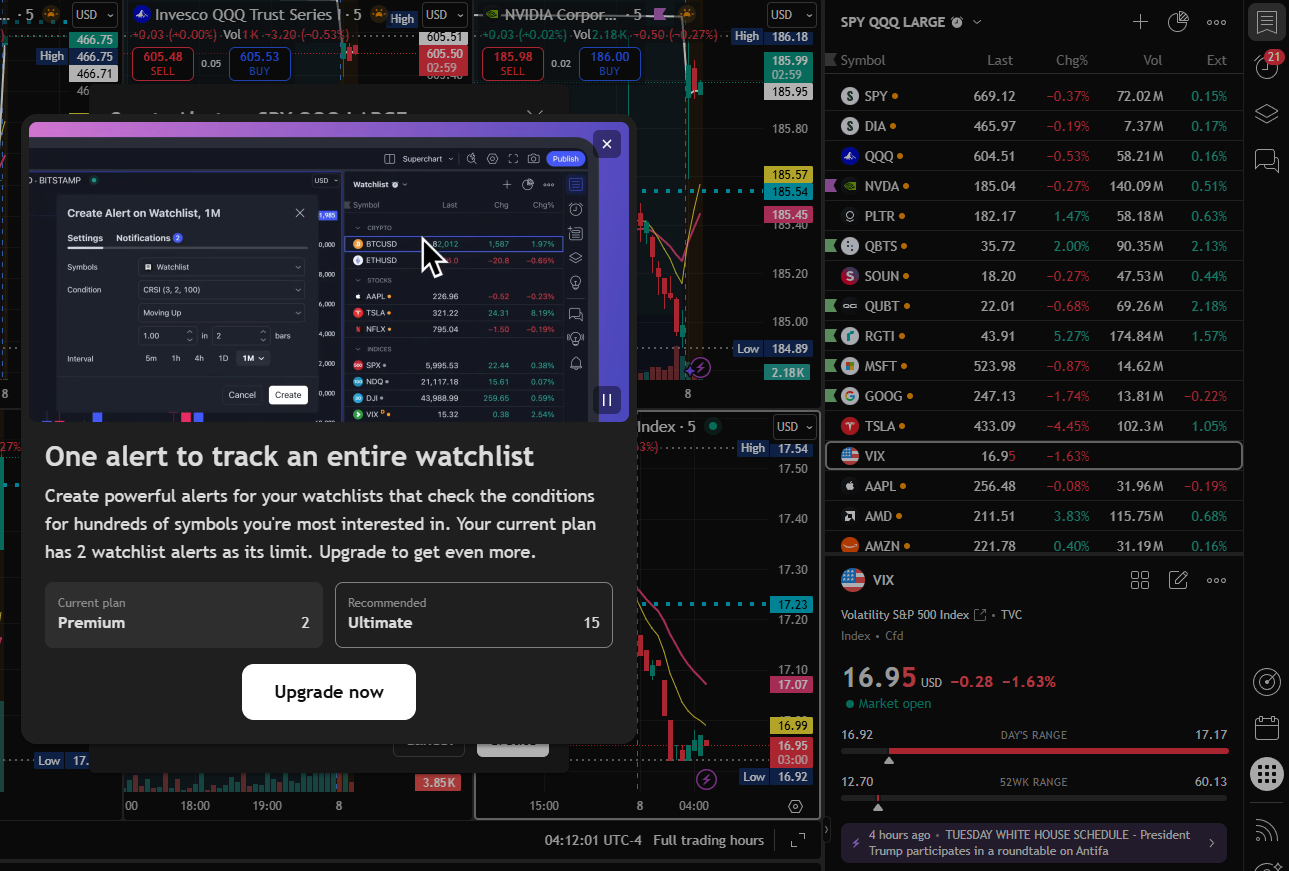
TradingView makes this easy — just right-click any level → “Add Alert. TradingView has recently introduced a game-changing alert feature that allows day traders to set customized alerts across their entire watchlist. Now, instead of monitoring each stock individually, traders can receive instant notifications when any stock in their watchlist meets specific criteria based on their strategy and preferences.
Having a pre-planned approach removes emotion and allows you to execute with discipline, especially in fast-moving conditions.
✅ Essential Element#6 Live Trading During Market Hours (9:30 AM – 4:00 PM)
This is where discipline and focus matter most. With your plan and alerts already in place, your job now is to execute with precision based on what the market gives you.
🔍 What to Monitor During Live Trading:
Confirm Market Trend
Use overall market sentiment (SPY, QQQ, etc.) and price action to validate whether it’s a trending or choppy day.
Confirm if your selected stock follows the broader trend or moving independently due to news/catalyst.
Observe Price Action Around Key Levels
Monitor behavior near your predefined support/resistance zones (from daily/hourly)
Check for confirmation candles, retests, and fakeouts before entering.
Watch Volume and Order Flow
Look for volume surges at breakout/breakdown points.
Use Level 2 and Time & Sales to read real-time buyer/seller pressure.
Use Key Technical Indicators
VWAP (Volume Weighted Average Price):
For long setups, prefer buying above VWAP, especially when price holds above with increasing volume.
If trading short, price breaking and holding below VWAP can confirm downside bias.
EMA 9/20/50/200: Use for trend alignment and dynamic support/resistance.
MACD/RSI (optional): Add confluence to entries if aligned with momentum.
Track Your Setup in Action
Follow only your predefined setup(s).
Avoid chasing trades not part of your plan — stay focused.
Adjust to New Developments
Mark new intraday S/R levels on lower time frames (1-min, 5-min).
Tighten or trail stop-loss if trade moves in your favor.
Update profit target if momentum is strong or volume is fading.
Stick to the plan. Execute With Discipline
Use appropriate order types based on the market phase.
Stick to your risk/reward plan — aim for at least 2:1 R/R.
Avoid emotional decisions — keep your edge by staying consistent.
Don’t enter randomly — wait for your exact signal.
Stick to your stop-loss and risk parameters.
Ma#7. Track Every Trade Like a Pro – Because Guesswork Kills Profits
"If you’re not tracking, you’re gambling."
Day trading without reviewing your trades is like driving blindfolded—you might survive a few turns, but eventually, you’ll crash. Consistent profitability comes from analyzing your wins, losses, and patterns. Here’s why tracking is non-negotiable:
Spot Weaknesses: Are you overtrading? Falling for revenge trades? Losing more in choppy markets? Your journal exposes the truth.
Refine Your Edge: Identify which setups work (e.g., morning breakouts vs. afternoon reversals) and double down on them.
Emotional Discipline: Seeing cold, hard data keeps ego in check—no more blaming "bad luck" for preventable mistakes.
Progress Proof: Metrics like win rate, risk-reward ratio, and average P/L per trade tell you if you’re improving or just spinning wheels.
How to Do It Right:
✔ Log every trade (entry/exit, time, setup, emotions).
✔ Weekly reviews—highlight repeating mistakes and adjust.
✔ Use tools (TradingView, Excel, or dedicated journals like TraderVue).Bottom Line: The difference between a struggling trader and a consistent one? The disciplined trader knows their numbers. Start tracking today—your future self will thank you.nage emotions — no revenge trades or chasing.
Tracking Trades & Results—a key element often overlooked but critical for long-term success.
Essential Elelment #7:Tracking Trades & Results
"If you’re not tracking, you’re gambling."
Day trading without reviewing your trades is like driving blindfolded—you might survive a few turns, but eventually, you’ll crash. Consistent profitability comes from analyzing your wins, losses, and patterns. Here’s why tracking is non-negotiable:
Spot Weaknesses: Are you overtrading? Falling for revenge trades? Losing more in choppy markets? Your journal exposes the truth.
Refine Your Edge: Identify which setups work (e.g., morning breakouts vs. afternoon reversals) and double down on them.
Emotional Discipline: Seeing cold, hard data keeps ego in check—no more blaming "bad luck" for preventable mistakes.
Progress Proof: Metrics like win rate, risk-reward ratio, and average P/L per trade tell you if you’re improving or just spinning wheels.
How to Do It Right:
✔ Log every trade (entry/exit, time, setup, emotions).
✔ Weekly reviews—highlight repeating mistakes and adjust.
✔ Use tools (TradingView, Excel, or dedicated journals like TraderVue).Bottom Line: The difference between a struggling trader and a consistent one? The disciplined trader knows their numbers. Start tracking today—your future self will thank you.
Stocks Daily Trading Log & Performance Sheet.
Download Now – It's Free
STOCKS DAY TRADING STRATEGIES
1.Momentum Trading
Core Idea: Ride the wave of strong price movement, usually driven by volume and news.
When to Trade: During a strong intraday trend, regardless of how the stock opened.
Entry Triggers:
Price breaking key resistance
Volume surge
Technical confirmations (MACD cross, EMA alignment, etc.)
Timeframe: Often starts after the market open, but not necessarily in the first 5–15 minutes.
Example: Stock breaks out from a consolidation pattern at 10:15 AM with strong volume.
Gap and Go
Core Idea: Exploit the volatility of stocks that gap up in premarket (often with news), aiming for an early breakout.
When to Trade: Right at or just after the market open (first 1–5 minutes).
Entry Triggers:
Premarket gap + high volume
Break of premarket high
Quick confirmation with Level 2 or tape
Timeframe: Very early — it’s all about fast setups and early momentum.
Example: Stock gaps 20% overnight and breaks above the premarket high within the first 2 minutes of the open.
So Why Do People Confuse Them?Because:
Both rely on volume, news catalysts, and fast-moving price action
Both can be applied to the same stocks (e.g., low-float gappers)
Momentum is part of the Gap and Go strategy — but Gap and Go is a very specific subset of momentum setups
Momentum Day Trading Strategy (Stocks) – Core Definition
Core Idea: Capitalize on strong intraday price surges fueled by high volume and news catalysts. .A high-probability intraday approach of price movements by entering trends early and exiting before momentum fades.
Key Components
1. Stock Selection Criteria
Liquidity: Minimum 500k+ avg. daily volume (slippage protection).
Volatility: Average True Range (ATR) ≥ 1.5x stock’s normal range.
Catalyst: Earnings, sector momentum, or technical breakouts.
2. Entry Triggers
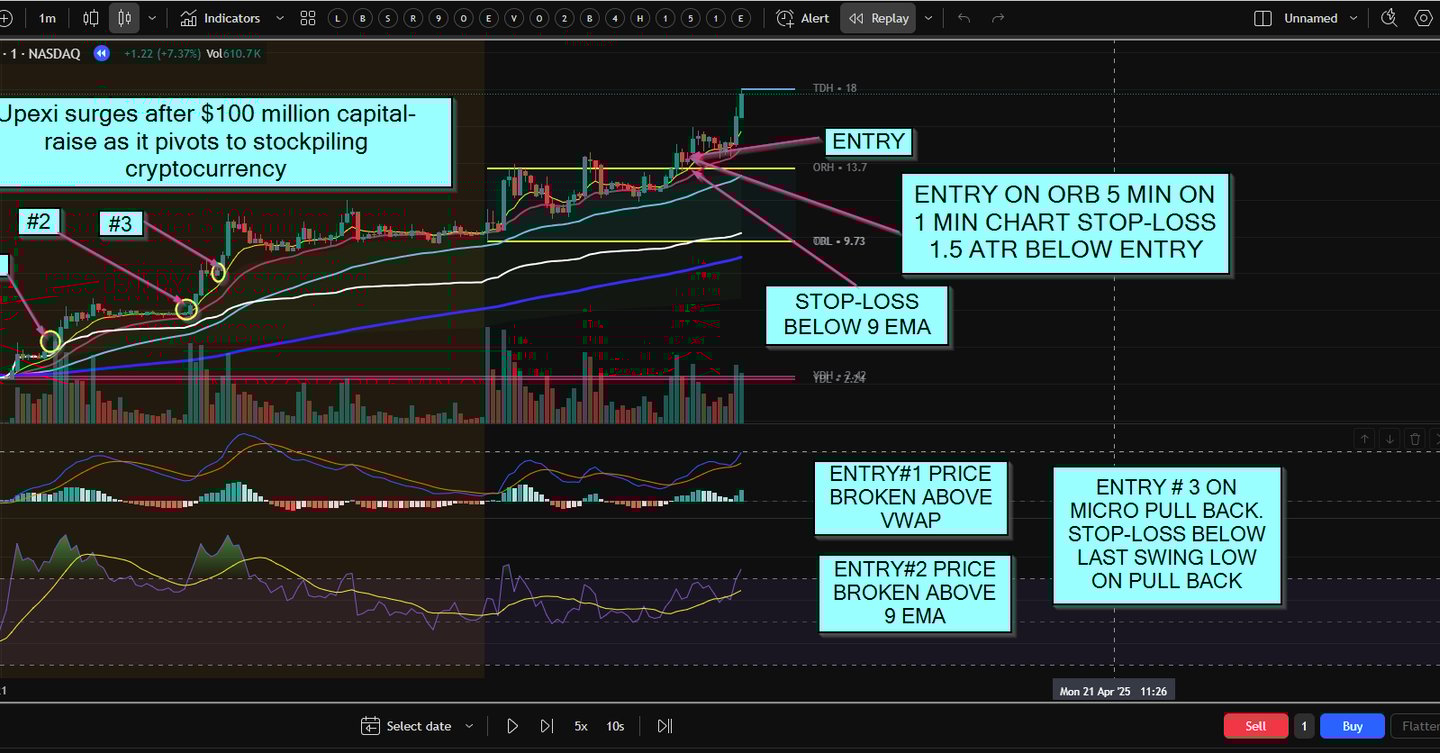
Breakout Pullback: Price clears resistance, retests, and bounces with volume (e.g., 5-min high + pullback to VWAP).
Volume Spike: Surge ≥ 2x 20-day avg volume with price acceleration.
Squeeze Setup: Bollinger Band contraction + MACD crossover.
3. Exit Rules
Trailing Stop: 1.5x ATR or below nearest swing low.
Volume Divergence: Price makes new high but volume declines → exit.
Time-Based: Close all trades by 3:30 PM ET (avoid late-day reversals).
4. Risk Management
Position Size: 1-2% account risk per trade.
Max Daily Loss: 5% account cap.
No Revenge Trading: 3 losing trades = stop trading for the day.
Tools for Execution
When to Trade:
During strong intraday trends, whether the stock gapped up/down or opened flat.
Not limited to the open—setups often emerge after the first 15–30 minutes once direction confirms.
Refined Entry Triggers
Price Breaks Key Resistance/Support
Clear breakout above consolidation or prior high (e.g., 5-minute chart).
Volume Surge (2–3x Average)
Institutional buying/selling confirms momentum.
Technical Confirmations
MACD crossover above zero line.
Price holding above 9/20 EMA stack.
RSI (50–70) showing strength without being overbought.
Small-Cap Momentum Scanner (Pre-Market/Day Trading)
Mid-Cap Momentum Scanner (2B−2B−10B Market Cap)
Large-Cap Momentum Scanner (>$10B Market Cap)
Mid-Cap Momentum Scanner
Large-Cap Momentum Scanner
2. Breakout Trading
Breakout trading involves identifying stocks that are breaking out of key levels of support or resistance, often accompanied by high volume.
How It Works:
Look for small-cap stocks consolidating near resistance (for breakouts) or support (for breakdowns).
Enter trades when the stock breaks above resistance (long) or below support (short) with volume confirmation.
Set stop-loss orders just below the breakout level.
Why It’s Popular:
Breakouts often lead to significant price movements in small-cap stocks.
Easy to identify using technical analysis tools like trendlines and moving averages.
3. News-Based Trading
Small-cap stocks are highly sensitive to news, making this a go-to strategy for many traders.
How It Works:
Monitor news feeds, press releases, and social media for small-cap stocks with breaking news (e.g., FDA approvals, partnerships, earnings surprises).
Trade stocks with positive news for long positions and negative news for short positions.
Be cautious of "pump and dump" schemes and verify the credibility of the news.
Why It’s Popular:
News can cause rapid and significant price movements in small-cap stocks.
Provides clear catalysts for entry and exit.
4. Scalping
Scalping involves making quick trades to capture small price movements, often holding positions for just seconds or minutes.
How It Works:
Use Level 2 data and time & sales to identify liquidity and order flow.
Focus on small-cap stocks with tight bid-ask spreads and high volatility.
Set strict profit targets (e.g., 1-2%) and stop-loss levels (e.g., 0.5-1%).
Why It’s Popular:
Small-cap stocks often exhibit rapid price movements, making them ideal for scalping.
Allows traders to lock in small, consistent profits throughout the day.
5. Reversal Trading (Fading the Move)
Reversal trading involves identifying overextended moves and trading against the trend for a potential reversal.
How It Works:
Use indicators like RSI or stochastic oscillators to identify overbought (above 70) or oversold (below 30) conditions.
Look for reversal candlestick patterns (e.g., doji, engulfing) or trendline breaks.
Enter trades when the stock shows signs of reversing and set tight stop-loss orders.
Why It’s Popular:
Small-cap stocks often overextend during trends, creating opportunities for reversals.
High reward potential if timed correctly.
6. High Relative Volume Trading
Traders focus on small-cap stocks with unusually high trading volume, which often indicates increased interest and potential price movement.
How It Works:
Use a stock screener to identify small-cap stocks trading at 2-3x their average daily volume.
Enter trades when the stock breaks key levels on high volume.
Set stop-loss orders to manage risk.
Why It’s Popular:
High volume often precedes significant price movements.
Easy to identify using stock screeners.
7. Sector Rotation Trading
Small-cap stocks often move in tandem with their sectors or industries. Traders use this to their advantage by focusing on strong sectors.
How It Works:
Use sector ETFs or heatmaps to identify trending sectors.
Trade small-cap stocks within strong sectors for long positions and avoid those in weak sectors.
Diversify trades across multiple sectors to reduce risk.
Why It’s Popular:
Provides a broader market context for trading decisions.
Increases the probability of success by aligning with sector momentum.
8. VWAP (Volume-Weighted Average Price) Trading
VWAP is a popular indicator used by day traders to identify the average price of a stock based on volume and price.
How It Works:
Use VWAP as a dynamic support/resistance level.
Buy when the stock pulls back to VWAP and shows signs of bouncing (long).
Sell when the stock rallies to VWAP and shows signs of rejection (short).
Why It’s Popular:
VWAP is a reliable indicator for intraday trends.
Works well in small-cap stocks due to their tendency to revert to the mean.
9. Penny Stock Breakouts
Many small-cap stocks are penny stocks (trading under $5), which can experience explosive moves.
How It Works:
Identify penny stocks with strong volume and breaking out of key levels.
Enter trades on the breakout and ride the momentum.
Be cautious of low liquidity and potential manipulation.
Why It’s Popular:
Penny stocks can deliver massive percentage gains in a short time.
Attracts traders looking for high-risk, high-reward opportunities.
10. End-of-Day (EOD) Momentum
Traders focus on small-cap stocks showing strong momentum in the last hour of trading.
How It Works:
Identify stocks with strong volume and price movement in the last hour.
Enter trades to ride the momentum into the close.
Exit before the market closes or hold for a potential gap the next day.
Why It’s Popular:
The last hour often sees increased activity and momentum.
Provides opportunities for quick profits before the market closes.
Most Popular Strategy Overall
The Momentum Trading (Gap and Go) strategy is arguably the most popular among small-cap day traders due to its simplicity and high reward potential. It leverages the explosive moves that small-cap stocks often experience after significant news or earnings events.
Key Tools for Small-Cap Day Traders
Stock Screeners: Finviz, Trade Ideas, or Thinkorswim.
Charting Platforms: TradingView, Thinkorswim, or MetaTrader.
News Sources: Benzinga, Bloomberg, or Twitter (for real-time updates).
Level 2 Data: Essential for understanding order flow and liquidity.
1. Momentum Trading (Gap and Go)
This is one of the most popular strategies for small-cap stocks. Traders focus on stocks that are gapping up or down in pre-market due to news, earnings, or other catalysts.
How It Works:
Identify stocks with significant pre-market gaps (up or down).
Enter trades when the stock confirms the gap direction after the market opens (e.g., breaks the pre-market high for a gap-up or the pre-market low for a gap-down).
Ride the momentum for quick profits.
Why It’s Popular:
Small-cap stocks often experience explosive moves after gaps.
High reward potential in a short time frame.
Momentum Strategy for Stock Day Trading: A Comprehensive Guide
Understanding Momentum Trading
Momentum trading is a strategy that capitalizes on the continuation of existing market trends. Day traders using this approach seek to identify stocks showing strong upward or downward movement and ride that momentum for short-term profits.
Key Principles of Momentum Trading:
"The trend is your friend" - follow established directional movements
High volume confirms genuine momentum
Strong price movement tends to continue in the short term
Quick entries and exits are essential
Developing Your Momentum Trading Plan
Scanning for Candidates:
Use stock screeners to find stocks with:
Price increases >3% on above-average volume
Breaking through key resistance levels
Showing strong relative strength vs. sector/index
Entry Strategies:
Breakout entry: When price clears resistance with volume
Pullback entry: Waiting for small retracement in an established trend
Gap continuation: Trading in direction of morning gap
Exit Strategies:
Pre-defined profit targets (1:2 or 1:3 risk-reward ratios)
Trailing stop losses to protect profits
Reversal signals from momentum indicators
Risk Management Essentials
Position Sizing: Never risk more than 1-2% of capital on a single trade
Stop Losses: Always use stop orders (mental or physical)
Time Stops: Exit if trade doesn't move as expected within timeframe
Sector Correlation: Avoid overexposure to single sector
Common Momentum Setups
1. Earnings Momentum Plays
Stocks gapping up on strong earnings with continued buying
2. News-Driven Momentum
Stocks reacting to sector news, product announcements
3. Technical Breakouts
Stocks breaking above consolidation patterns
Psychology of Momentum Trading
Requires discipline to follow the plan
Must overcome fear of missing out (FOMO)
Need to avoid revenge trading after losses
Essential to keep emotions in check during rapid moves
Tools for Momentum Traders
Real-time charting platforms (ThinkorSwim, TradingView)
Level 2 quotes and time & sales data
Hotkey trading for rapid execution
Scanner alerts for momentum candidates
Final Thoughts
Momentum trading can be highly profitable but requires strict discipline. Successful traders backtest their strategies, maintain detailed trade journals, and continuously refine their approaches. The key is consistency - sticking to your rules through both winning and losing streaks.
Would you like me to expand on any particular aspect of momentum trading strategies for your website? I can provide more detailed examples, case studies, or template trading plans.
please, change content with emphasozing on small cap stocks day trading strageies
Small-Cap Stocks Day Trading: Momentum Strategies for Maximum Gains
Small-cap stocks (typically under $2 billion market cap) offer explosive day trading opportunities due to their high volatility and lower institutional ownership. Unlike large caps, small caps can move 10%, 20%, or even 50% in a single day on strong momentum.
This guide covers high-probability momentum strategies tailored for small-cap stock day trading, including scanning, entries, exits, and risk management.
Why Small-Cap Stocks Are Ideal for Momentum Day Trading
✅ Higher Volatility – Small caps move faster than large caps, providing bigger intraday swings.
✅ Lower Float = Stronger Moves – Stocks with low float (under 20M shares) can gap and run aggressively.
✅ News-Driven Moves – Earnings, FDA approvals, contracts, or short squeezes can trigger massive momentum.
✅ Retail Trader Influence – Small caps are heavily traded by retail, creating momentum waves.
Risks to Watch Out For:
❌ Liquidity Gaps – Some small caps have wide bid-ask spreads.
❌ Pump & Dumps – Be cautious of manipulated stocks.
❌ Gaps Against You – Small caps can reverse hard—always use stops.
Best Momentum Strategies for Small-Cap Day Trading
1. The Pre-Market Gapper Strategy
How It Works:
Scan for small-cap stocks up 5%+ in pre-market on high volume.
Look for catalysts (news, earnings, upgrades) driving the move.
Wait for a pullback after market open (if overextended) or trade the continuation if volume stays strong.
Entry:
Buy when price holds above VWAP (Volume-Weighted Average Price) and pulls back to key support.
Avoid chasing if the stock gaps up but immediately reverses.
Exit:
Take profits at key resistance levels or when volume fades.
Use a trailing stop to lock in gains.
2. The Breakout Momentum Strategy
How It Works:
Identify small-cap stocks consolidating near key resistance (e.g., 52-week highs, multi-day squeeze).
Enter when price breaks out with strong volume (at least 2x average).
Entry:
Buy the breakout candle (or wait for a small retest of the breakout level).
Avoid fakeouts by ensuring volume confirms the move.
Exit:
Take partial profits at 1:2 or 1:3 risk-reward.
Trail the rest with a moving average (e.g., 9 EMA) or VWAP.
3. The Dip & Rip Strategy (For Strong Trend Days)
How It Works:
Find a small-cap stock already up 10%+ intraday but pulling back on lower volume.
Buy the dip when momentum resumes (e.g., bounce off VWAP or 9 EMA).
Entry:
Wait for volume surge on the bounce before entering.
Avoid stocks that keep making lower highs (sign of weakness).
Exit:
Ride the trend until volume drops or price stalls at resistance.
Use a tight trailing stop to protect profits.
4. The Short Squeeze Momentum Play
How It Works:
Scan for small-cap stocks with high short interest (20%+ float) and sudden buying pressure.
Look for rapid price spikes + increasing volume, forcing shorts to cover.
Entry:
Enter when price breaks key resistance with heavy volume.
Avoid late entries when the squeeze is already extended.
Exit:
Watch for parabolic moves—these often reverse hard.
Exit when volume declines or price starts forming long upper wicks.
Best Indicators for Small-Cap Momentum Trading
✔ Volume – The #1 indicator for small caps (no volume = no momentum).
✔ VWAP – Acts as dynamic support/resistance.
✔ 9 EMA / 20 EMA – Helps spot intraday trends.
✔ Relative Strength (RSI > 60 for uptrends, RSI < 40 for downtrends).
Risk Management Rules for Small-Cap Trading
🔹 Trade Small Position Sizes – Small caps can gap against you fast.
🔹 Always Use a Stop-Loss – Never let a losing trade run.
🔹 Avoid Overtrading – Focus on 1-3 high-quality setups per day.
🔹 Trade the Best Hours – Highest volume is usually 9:30-11:30 AM ET.
Final Thoughts
Small-cap momentum trading can be extremely profitable if you focus on high-volume movers, trade with discipline, and cut losses quickly. The key is sticking to your strategy and not getting greedy—small caps can reverse just as fast as they spike.
Small-Cap Momentum Day Trading: Real Trade Examples & Scanning Checklist
Real Trade Examples (Small-Cap Momentum Strategies)
Example 1: Pre-Market Gapper Play (News Catalyst)
Stock: $XXII (Small-cap biotech)
Catalyst: FDA approval news in pre-market
Setup:
Gapped up +35% pre-market on 10x average volume
At market open, pulled back to VWAP but held
Volume remained strong (3x average)
Trade Execution:
Entry: $4.20 (after initial pullback to VWAP)
Exit: $5.80 (near session high when volume slowed)
Profit: +38% intraday
Key Lesson:
✅ Trade with the trend—don’t fade the gap.
✅ Wait for a pullback to confirm strength before entering.
Example 2: Breakout Momentum (Low Float Runner)
Stock: $ATER (Retail trader favorite, low float)
Setup:
Consolidated near $5.00 resistance for 3 days
Broke out on 5x average volume
Short interest was high (potential squeeze)
Trade Execution:
Entry: $5.25 (breakout candle)
Exit: $6.50 (when RSI hit >80 and volume dropped)
Profit: +24% in 2 hours
Key Lesson:
✅ Low float + breakout = explosive move.
✅ Exit when volume declines or RSI becomes overbought.
Example 3: Dip & Rip (Trend Continuation)
Stock: $BBIG (Meme stock with strong intraday trend)
Setup:
Already up +15% by 10 AM
Pulled back to 9 EMA on lower volume
Bounced with renewed buying
Trade Execution:
Entry: $3.40 (EMA bounce)
Exit: $4.10 (at previous resistance level)
Profit: +20% in 45 minutes
Key Lesson:
✅ Trade pullbacks in strong trends, not against them.
✅ Use moving averages (9 EMA / 20 EMA) as dynamic support.
Small-Cap Momentum Scanning Checklist
To find the best small-cap momentum plays, use these filters in your stock scanner (e.g., Trade Ideas, Finviz, or ThinkorSwim):
Pre-Market Scan (For Gappers)
Price: 2−2−20 (ideal for retail traders)
Pre-Market Gain: +5% or more
Pre-Market Volume: 2x+ average daily volume
Float: Under 50M shares (low float = bigger moves)
Catalyst: News, earnings, or sector momentum
Intraday Momentum Scan (For Breakouts & Runners)
Price: 1−1−30
Relative Volume: 3x+ average
Float: Under 100M shares
RSI (14): Between 40-80 (avoid overbought stocks unless squeezing)
Recent Price Action: Breaking key resistance or bouncing off support
Short Squeeze Scan (For Explosive Moves)
Short Interest: 20%+ of float
Float: Under 30M shares
Volume Spike: 5x+ average
Price Action: Up 10%+ with increasing volume
Bonus: Small-Cap Trading Watchlist Template
Track potential momentum plays with this format:
Final Tips for Small-Cap Momentum Success
🔥 Trade the first 2 hours – Best volume and momentum.
🔥 Avoid penny stocks (<$1) – Too risky, prone to manipulation.
🔥 Stick to high-volume movers – No volume = no momentum.
🔥 Use hotkeys for fast execution – Small caps move fast.
Small-Cap Momentum Day Trading: Complete Trading Plan & Risk Management Template
Step-by-Step Small-Cap Trading Plan
1. Pre-Market Preparation (6:30-9:00 AM ET)
Scan for gappers using filters:
Price :2−20
Pre-market volume >100k shares
Up 5%+ on news/earnings
Check catalysts (SEC filings, PR news, sector momentum)
Review float & short interest (under 50M float ideal)
Set watchlist alerts at key levels (breakout points, VWAP)
2. Market Open (9:30-10:00 AM ET)
Watch for false breakouts - first 5-15 minutes often volatile
Confirm volume - real momentum needs increasing volume
Enter only when:
Price holds above VWAP (for longs)
Volume exceeds 3x daily average
Stock shows relative strength vs sector
3. Mid-Day Trading (10:00 AM-2:00 PM ET)
Focus on continuation plays:
Stocks that held morning gains
Pullbacks to 9 EMA with volume
Breakouts from consolidation
Avoid new positions after 2:00 PM (liquidity drops)
4. End of Day (2:30-4:00 PM ET)
Take profits on winning trades
Close risky positions - small caps often fade into close
Prepare next day's watchlist
Risk Management Template
Trade Parameters
ParameterRuleMax Risk Per Trade1% of accountPosition Size(Account risk amount) / (entry - stop loss)Stop Loss5-7% below entry (or technical level)Profit Targets1:2 or 1:3 risk-reward minimumMax Daily Loss3% of accountMax Trades/Day3 high-conviction setups
Common Small-Cap Trading Mistakes to Avoid
Chasing Extended Moves
Don't buy stocks up 30%+ without a pullback
Ignoring Volume
No volume = no conviction in the move
Overtrading
Wait for A+ setups, not forced trades
Holding Overnight
Small caps can gap down 20%+ on no news
Not Using Stop Losses
"It'll come back" is an account killer
Advanced Small-Cap Trading Tactics
The 3-Day Momentum Pattern
Day 1: Big move on news (watch)
Day 2: Pullback on lower volume (potential entry)
Day 3: Continuation move (best profit opportunity)
The "Power Hour" Strategy
Focus on 10:30-11:30 AM ET when:
Morning volatility settles
True trends emerge
Institutional algorithms become active
The 2PM Reversal Signal
Watch for stocks that:
Held gains all day
Start breaking highs after 2PM
Often leads to end-of-day momentum
Final Checklist Before Entering Any Trade
✅ Catalyst present? (News, earnings, sector move)
✅ Volume >3x average?
✅ Float under 50M shares?
✅ Price between 2−2−20?
✅ Stop loss level identified?
✅ Risk:Reward at least 1:2?
✅ Not chasing >10% extended?
Would you like me to add any additional sections such as:
Brokerage recommendations for small-cap trading
How to handle trading halts in small caps
Psychological exercises for day traders
Tax considerations for active traders
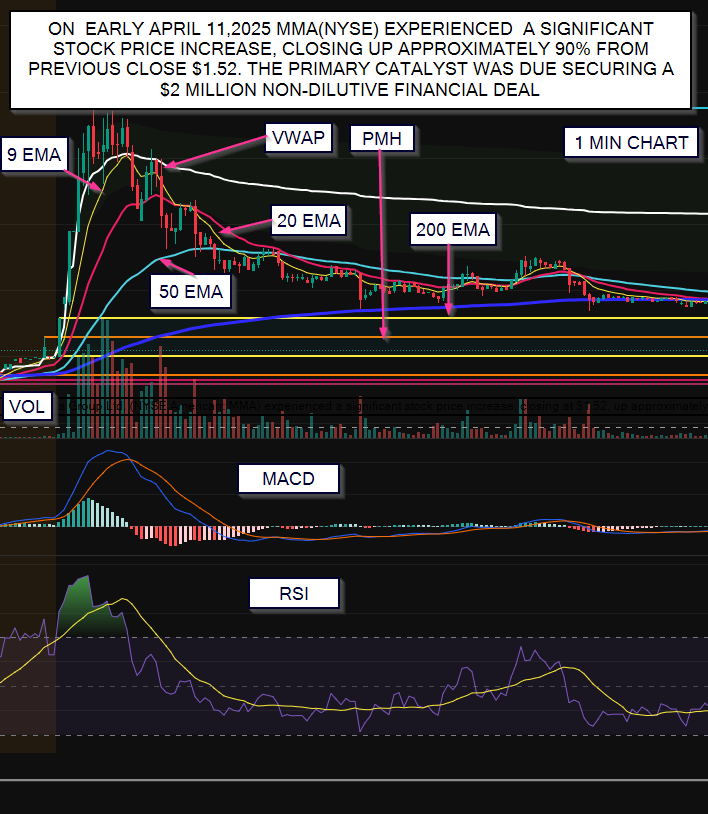
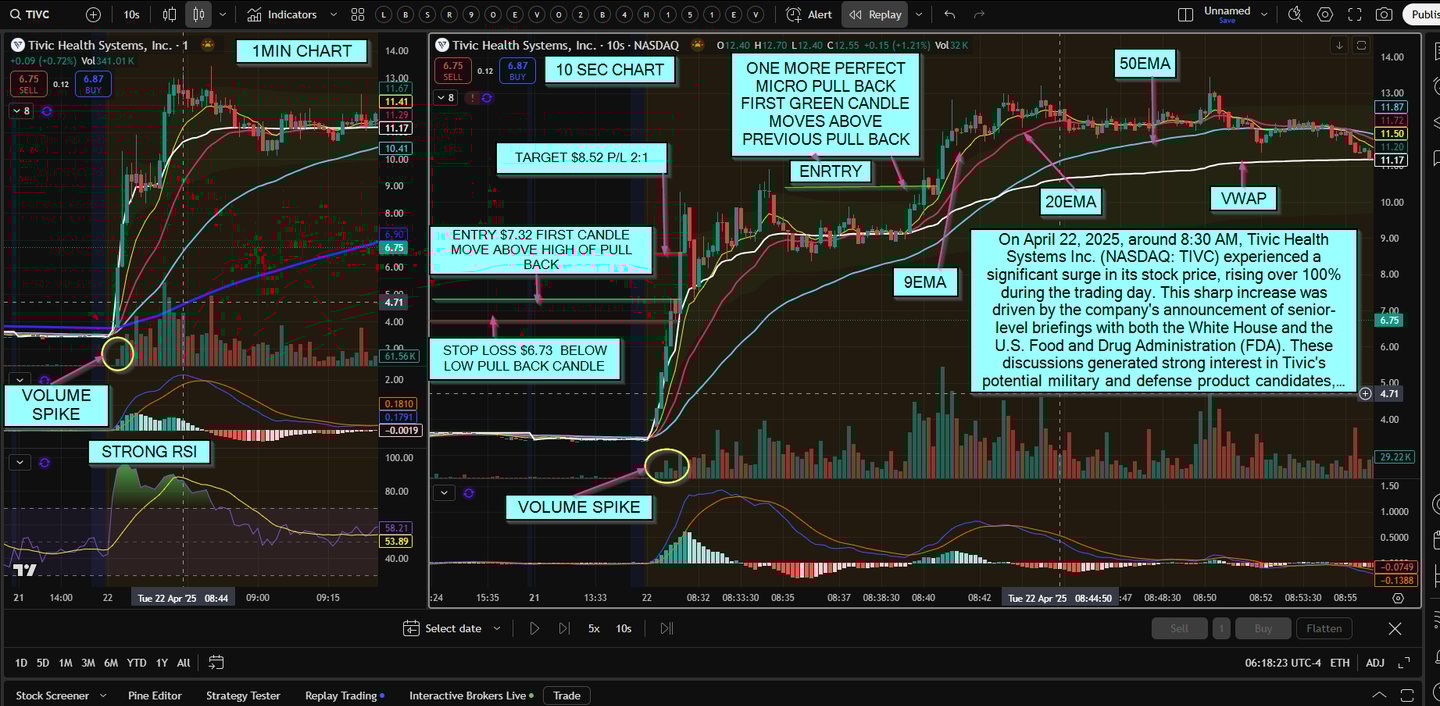
On April 11, 2025, Mixed Martial Arts Group Ltd. (NYSE American: MMA) experienced a significant stock price increase, closing at $1.52, up approximately 89% from the previous close. The primary catalyst for this surge was the company's announcement of securing a $2 million non-dilutive financing deal and implementing a board restructuring. Additionally, MMA's recent initiatives, such as expanding into Latin America through its BJJLink platform, have contributed to investor optimism.
Great question! The relationship between "Gap & Go" and momentum trading often causes confusion. Here’s the clear breakdown:
1. Gap & Go vs. Momentum Trading – Key Differences
AspectGap & Go StrategyMomentum TradingFocusExploits pre-market gaps (up/down)Trades intraday trends (breakouts, volume surges)TimeframePrimarily first 30-90 mins after openCan work all day if momentum holdsCatalystRelies on overnight news/earnings gapsCan be news-driven or technical (e.g., breakout from consolidation)RiskHigher (gaps can reverse/fill quickly)Moderate (follows confirmed intraday strength)
2. How They Overlap (Why Traders Mix Them Up)
Both strategies target strong, directional moves with high volume.
Gap & Go is a subset of momentum trading—it’s a specific opening-range momentum play.
Momentum trading is broader: It includes Gap & Go but also covers midday breakouts, squeeze plays, etc.
3. Which Is "Correct"?
Gap & Go is correct when:
You’re trading pre-market gaps with a plan to ride continuation (e.g., stock gaps up + holds above VWAP at open).
Example: $TSLA gaps up 5% on earnings, you buy if it pushes higher post-open.
Momentum trading is correct when:
You’re trading any strong trend intraday, regardless of a gap.
Example: $NVDA breaks out of a consolidation at 11 AM with surging volume.
4. Critical Nuance: Failed Gaps ≠ Momentum
A "gap fill" (stock reverses to fill the gap) kills the Gap & Go but can create a momentum short opportunity.
True momentum traders avoid faded gaps—they wait for confirmation (e.g., price holds above gap zone + volume confirms).
5. Pro Tip: Combine Both for Edge
Pre-market: Scan for high-volume gappers (potential Gap & Go).
At open: Filter for stocks holding gap direction (no fill) + volume.
Midday: Shift to pure momentum (breakouts, VWAP bounces).
Example Playbook:
9:30 AM: Buy $AMD if it gaps up and holds above pre-market high.
11:00 AM: Short $META if it breaks below morning low with volume.
Bottom Line
Gap & Go is a specific opening momentum strategy.
Momentum trading is the umbrella category for all trend-following intraday trades.
Smart traders use both but adjust risk rules (gaps are riskier!).
Would you like sample scans or chart examples to spot these setups?
KEY DIFFERENCES BETWEEN MOMENTUM AND GAP AND GO STRATEGIES