
Master Stock Charts and Candlestick Patterns for Better Trade Entries
Chart patterns are visual formations on price charts that traders use to predict future market movements. They reflect the psychology of buyers and sellers, showing collective emotions like fear, greed, and indecision. These patterns often indicate potential trend continuation or reversal.
They work because human behavior tends to repeat, especially under similar market conditions. When faced with uncertainty or opportunity, traders often react in predictable ways. As a result, past patterns tend to repeat themselves, creating familiar formations on the chart that experienced traders recognize and act on—thus reinforcing the pattern itself.
CHART PATTERNS
KEY POINTS:
Patterns work best with volume confirmation.
Timeframes matter: patterns are more reliable on higher timeframes.
No pattern is 100% accurate—combine with other indicators.
Reversal Patterns
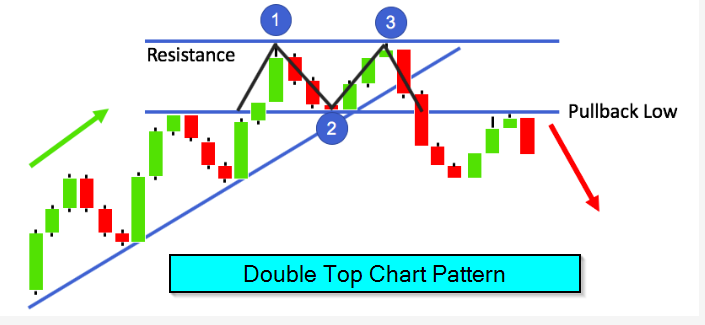
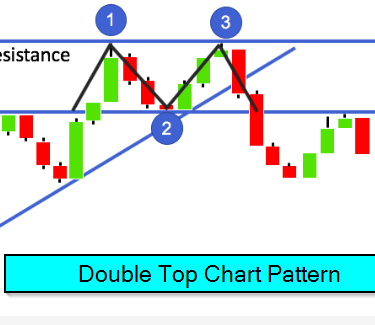
Double Top Pattern – Potential Trend Reversal from Up to Down
The Double Top is a bearish reversal pattern that signals a potential trend change from upward to downward. It forms after a strong uptrend and consists of two peaks at a similar price level, with a pullback (dip) in between.
How It Works:
The Double Top is a bearish reversal pattern that signals a potential trend reversal from up to down. It forms after a strong uptrend and consists of two peaks at a similar price level, with a pullback in between.
How to Trade It:
First Peak – Price reaches a high, then pulls back.
Second Peak – Buyers push price up again but fail to break higher, confirming resistance.
Breakdown – The pattern completes when price closes below the pullback low (support level).
Retest (Optional) – Price may retest the broken support (now resistance) before dropping further.
Optimal Trade Entry & Risk Management:
✔ Entry (Short/Sell):
Aggressive: Enter after the breakdown candle closes below support.
Conservative: Wait for a retest of the broken support (now resistance) before selling.
✔ Stop Loss Placement: (Choose one of these smarter methods)
Above Recent Swing High: Place stop slightly above the last minor swing high before the breakdown.
ATR-Based Stop: Use 1.5x-2x ATR (14-period) above your entry to account for volatility.
Above Second Peak (Only if tight enough): If the peaks are close, a stop just above the second top may work.
✔ Take-Profit Target:
Minimum Target: Measure the height from peaks to support – expect at least that much downside.
Trailing Stop: If the trend accelerates, move stop to breakeven & trail for larger gains.
Key Confirmation Factors:
🔹 Volume: Rising volume on the breakdown strengthens the signal.
🔹 Stronger Signal: A lower second peak (vs. equal highs) shows weakening demand.
🔹 Momentum Divergence: RSI/MACD showing lower highs during second peak adds confirmation.Pattern Failure:
❌ If price breaks above both peaks after entry, exit immediately.
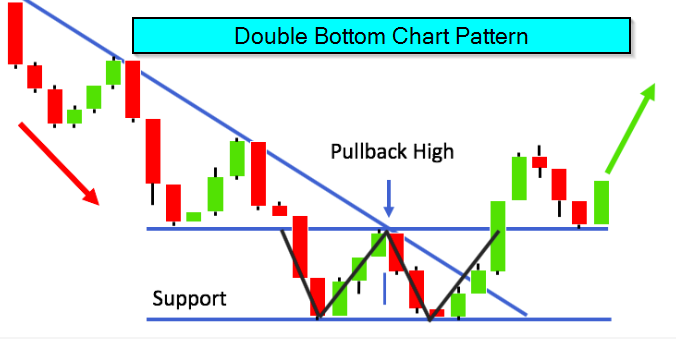
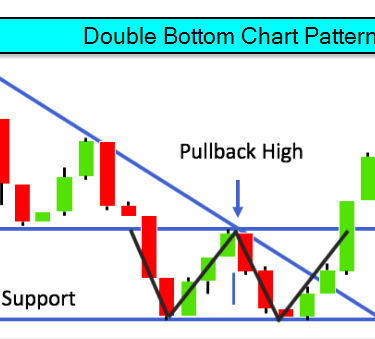
Double Bottom Pattern – Potential Trend Reversa from Down to UP
The Double Bottom is a bullish reversal pattern signaling a potential trend change from down to up. It forms after a downtrend and consists of two lows at a similar price level, separated by a pullback.
How to Trade It:
First Low – Price hits a support level and bounces.
Pullback – Sellers push price down again but fail to break lower.
Second Low – Price forms a matching/ slightly higher low, confirming demand.
Breakout – The pattern completes when price closes above the pullback high (resistance level).
Retest (Optional) – Price may retest the breakout level (now support) before rallying.
Optimized Trade Entry & Risk Management:
✔ Entry (Long/Buy):
Aggressive: Enter after the breakout candle closes above resistance.
Conservative: Wait for a retest of the breakout level (now support) before buying.
✔ Stop Loss Placement (Choose the tighter option):
Below Recent Swing Low: Place stop slightly below the last minor swing low before the breakout.
ATR-Based Stop: Use 1.5x-2x ATR (14-period) below your entry to account for volatility.
Below Second Low (If tight enough): Only viable if the lows are very close.
✔ Take-Profit Targets:
Minimum Target: Measure the height from lows to resistance – expect at least that much upside.
Trailing Stop: Move stop to breakeven as price rises, then trail to lock in profits.
Key Confirmation Factors:
🔹 Volume: Rising volume on the breakout adds validity.
🔹 Stronger Signal: A higher second low (vs. equal lows) shows increasing demand.
Pattern Failure:
❌ If price drops below both lows after your entry, exit immediately.
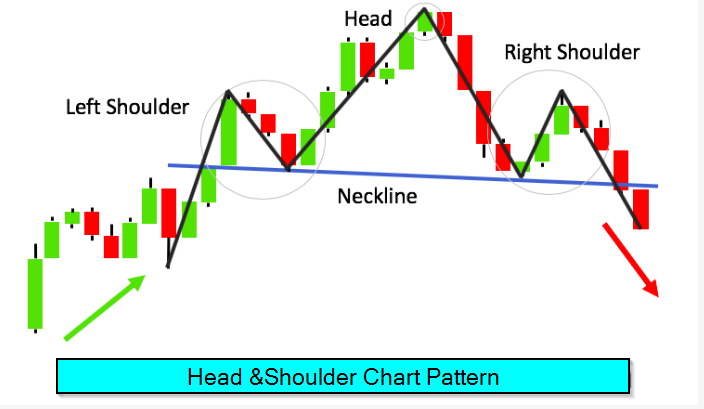
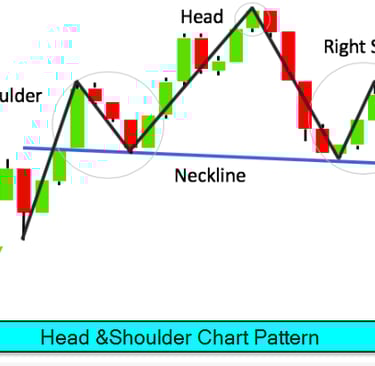
Head and Shoulders Pattern - Bearish Reversal Pattern
The Head and Shoulders is the most reliable bearish reversal pattern, signaling exhaustion in an uptrend. It consists of three peaks:
Left Shoulder (moderate high)
Head (highest peak)
Right Shoulder (lower high)
How to Trade It:
Formation Phase:
Left Shoulder forms with normal volume
Head forms on reduced volume
Right Shoulder forms on significantly lower volume
Breakout Confirmation:
Pattern completes when price closes below the neckline
Most reliable after a clear uptrend (minimum 20% rise)
Retest Opportunity:
58% of H&S patterns retest the neckline
Often the highest-probability entry point
Optimized Trade Setup:
✔ Entry Triggers:
Aggressive: Enter on neckline break (close below)
Conservative: Wait for retest of broken neckline
✔ Stop Loss Placement:
Above Right Shoulder (tightest logical level)
1.5x ATR(14) above entry for volatility adjustment
Never above the Head (risk becomes excessive)
✔ Profit Targets:
Minimum: Measure head to neckline, project downward
Extended: 1.618 Fibonacci extension of pattern height
Trail stop after 1:1.5 R/R achieved
Key Confirmation Factors:
🔹 Volume MUST decrease from Left Shoulder to Right Shoulder
🔹 RSI/MACD divergence during Head formation
🔹 Neckline slope (downward = more bearish)
🔹 Time symmetry (shoulders should take similar time to form)
Pattern Failure Signs:
❌ Price closes back above neckline after breakout
❌ Right Shoulder volume equals/exceeds Head volume
❌ Head forms on weak momentum (no divergence)
Pro Tip:
"Measure the time between shoulders - they should be roughly symmetrical. The most reliable H&S patterns form over 3-6 months on weekly charts."
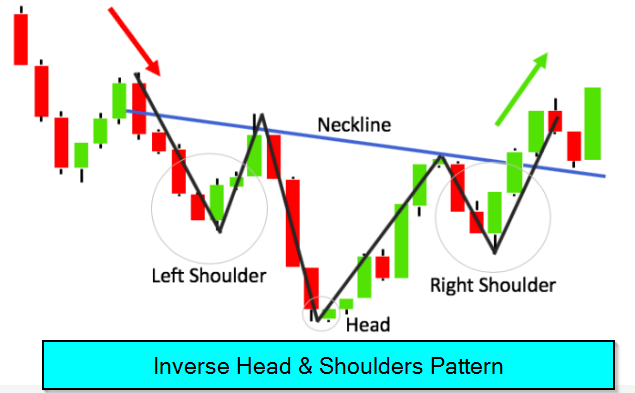
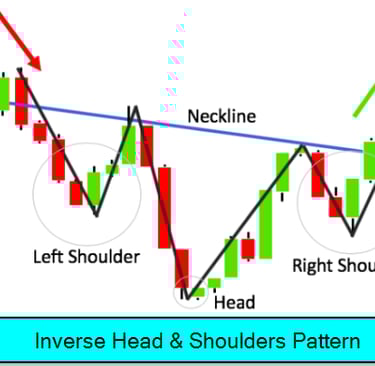
Inverse Head and Shoulders Pattern – Bullish Reversal Pattern
The Inverse Head and Shoulders (IH&S) is the bullish counterpart to the classic H&S, signaling a potential trend reversal from down to up. It consists of three troughs:
Left Shoulder (initial decline & bounce)
Head (lower low, often on weak momentum)
Right Shoulder (higher low, confirming demand)
The pattern completes when price breaks above the neckline (resistance connecting the highs between shoulders).
How to Trade the Inverse H&S
1. Pattern Formation
✅ Left Shoulder: Forms after a downtrend, with a low followed by a moderate bounce.
✅ Head: Price makes a lower low, but volume and momentum weaken (divergence often appears).
✅ Right Shoulder: Forms a higher low, showing reduced selling pressure.
✅ Neckline Break: Confirmation occurs when price closes above the neckline (drawn across recovery highs).
2. Key Confirmation Signals
🔹 Volume: Should increase on the breakout (unlike the regular H&S).
🔹 RSI/MACD: Look for bullish divergence during the Head formation.
🔹 Neckline Slope: Upward-sloping necklines are more bullish.
🔹 Symmetry: Shoulders should take similar time to form (not mandatory but strengthens validity).
Optimized Trade Setup
✔ Entry Strategies
Aggressive Entry: Buy on the first close above the neckline.
Conservative Entry: Wait for a pullback to retest the neckline (now support).
✔ Stop Loss Placement
Below Right Shoulder (tightest logical level).
1.5x ATR(14) below entry (adjusts for volatility).
Never below the Head (too wide, poor risk/reward).
✔ Profit Targets
Minimum Target: Measure Head to Neckline distance, project upward.
Extended Target: 1.618 Fibonacci extension of pattern height.
Trailing Stop: After 1:1.5 R/R is hit, move stop to breakeven.
Pattern Failure Warning Signs
❌ Price falls back below the neckline after breakout.
❌ Right Shoulder forms on higher volume than Head (indicates lingering selling pressure).
❌ No bullish momentum divergence at Head.
Pro Tip for Traders
"The strongest IH&S patterns form after prolonged downtrends (3+ months) on daily/weekly charts. Always check for supporting fundamentals (e.g., earnings recovery, sector strength)."
Continuation Patterns
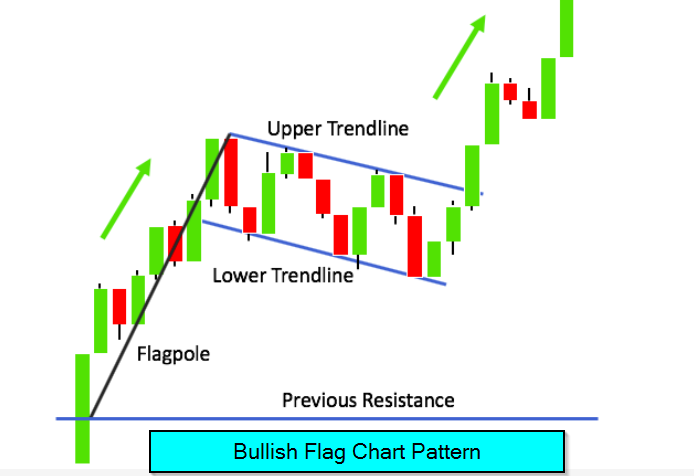
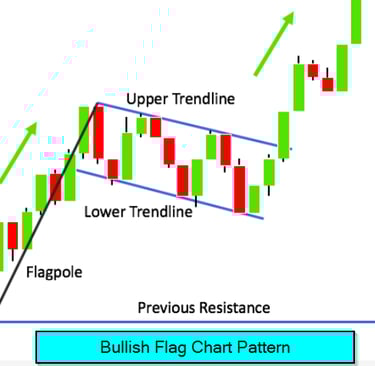
Bullish Flag Pattern – Reliable Continuation Trade Setup
The Bullish Flag is one of the most trustworthy continuation patterns, signaling a brief consolidation before the prevailing uptrend resumes. It forms after a sharp rally and resembles a small downward-sloping channel (the "flag") followed by a breakout to new highs
How to Identify & Trade the Bullish Flag
1. Pattern Structure
✅ Flagpole: A near-vertical price surge (typically 30-50%+ move) on strong volume.
✅ Flag: A shallow, downward-sloping consolidation (usually 10-25% retracement) on declining volume.
✅ Breakout: Pattern confirms when price closes above the flag’s upper trendline.
2. Key Confirmation Signals
🔹 Volume Profile:
Flagpole: High volume (institutional buying)
Flag: Volume dries up (lack of selling pressure)
Breakout: Volume surges again (confirmation)
🔹 Timeframe: Flags typically last 5-15 candles (shorter than pennants).
🔹 Slope: Ideal flags slope moderately downward (steep slopes may fail).
Optimized Trade Strategy
✔ Entry Triggers
Aggressive: Enter on first close above the flag’s upper trendline.
Conservative: Wait for a retest of the breakout level (now support).
✔ Stop Loss Placement
Below the flag’s lowest swing (tightest logical level).
1x ATR(14) below entry (adjusts for volatility).
✔ Profit Targets
Measured Move: Project the height of the flagpole upward from the breakout point.
Trailing Stop: After 1:1.5 R/R is hit, move stop to breakeven.
Pattern Failure Warning Signs
❌ Breakout occurs on weak volume (lack of conviction).
❌ Price falls back into the flag and breaks the lower trendline.
❌ Flag consolidation exceeds 20-25% retracement (risks trend reversal).
Pro Tip for Traders
"Bullish Flags work best in strong trending markets (e.g., earnings breakouts, sector rallies). On daily charts, pair with RSI(14) > 50 for added confirmation."
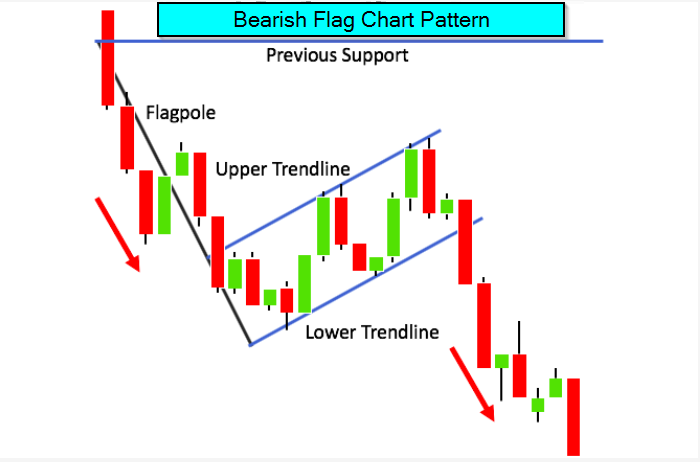
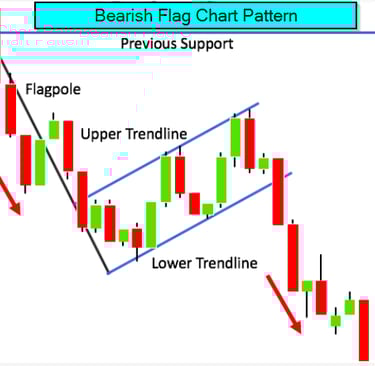
Bearish Flag Pattern – Reliable Continuation Setup
Pattern Structure
✅ Flagpole: Steep decline (30-50%+) on heavy volume
✅ Flag: Small upward-sloping channel (10-25% rebound) on fading volume
✅ Breakdown: Closes below flag's lower trendline
Key Confirmation
🔹 Volume collapses during flag, spikes at breakdown
🔹 RSI stays below 60 during rebound
🔹 Completes within 5-15 periods (faster fails)
Optimal Trade Plan
✔ Entry:
First close below flag (aggressive)
Retest of breakdown (conservative)
✔ Stop Loss:
Above flag's high (swing point)
OR 1.5x ATR(14) above entry
✔ Target:
100% flagpole length projected down
Trail stop after 1:2 R/R achieved
Failure Alerts
❌ Weak volume on breakdown
❌ Price re-enters flag formation
❌ Rebounds over 25% of drop
Pro Tip: "Watch for breakdowns during market weakness – flags often precede waterfall declines."
[Visual: Mark flagpole drop, flag rebound, breakdown candle]
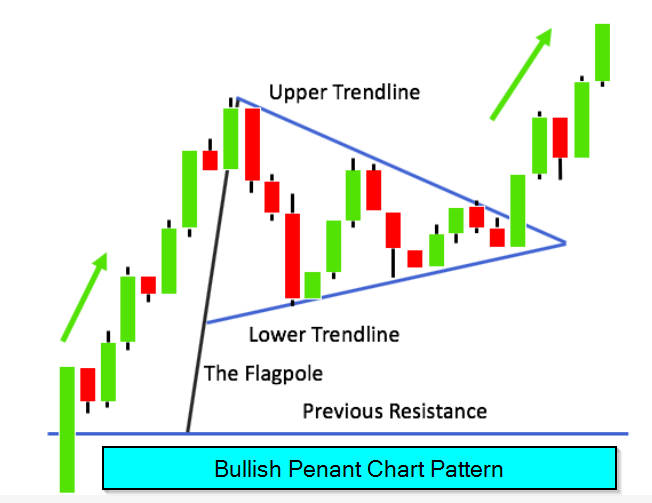
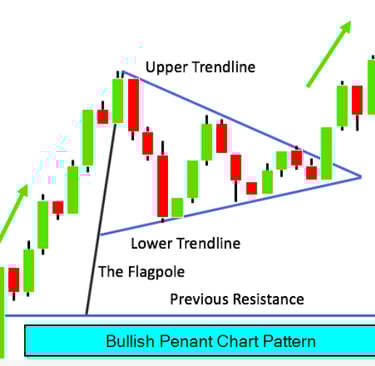
Bullish Pennant Pattern – High-Probability Continuation Trade
Pattern Structure
✅ Pole: Strong vertical rally (30%+ move) on surge in volume
✅ Pennant: Tight symmetrical triangle (5-20 candles) with shrinking volume
✅ Breakout: Decisive close above upper trendline
Key Confirmation Signals
🔹 Volume drops 80%+ during pennant formation
🔹 RSI holds above 40 during consolidation
🔹 Breakout occurs in direction of prior trend
Precision Trading Setup
✔ Entry Triggers:
Aggressive: First candle closing above pennant
Conservative: Retest of breakout level
✔ Stop Placement:
Below pennant's lowest swing point
OR 1x ATR(14) below entry
✔ Profit Targets:
Minimum: Measured move of pole length
Extended: 161.8% Fibonacci extension
Failure Warning Signs
❌ Breakout on below-average volume
❌ Price lingers >20 periods in pennant
❌ Violates lower trendline before breakout
Pro Tip: "Pennants work best when they form after explosive news-driven moves – the tighter the coil, the stronger the spring."
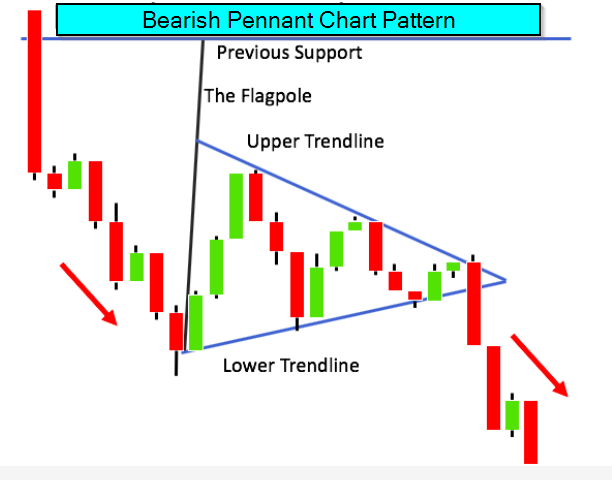
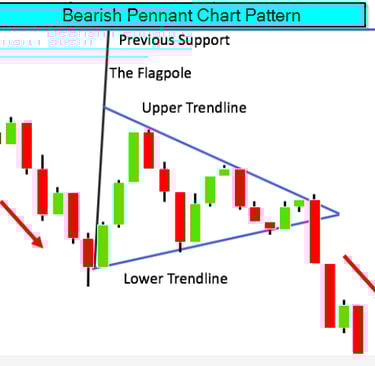
Bearish Pennant Pattern – Continuation Trade Setup
Pattern Structure
✅ Pole: Sharp decline (30%+ drop) on high volume
✅ Pennant: Tight symmetrical consolidation (5-20 periods) with shrinking volume
✅ Breakdown: Clear close below lower trendline
Key Confirmation
🔹 Volume decreases 80%+ during pennant formation
🔹 RSI stays below 60 during rebound
🔹 Breakdown occurs with volume expansion
Trade Execution
✔ Entry Triggers:
First candle closing below pennant (aggressive)
Retest of breakdown level (conservative)
✔ Stop Loss:
Above pennant's highest point
OR 1x ATR(14) above entry
✔ Profit Targets:
Minimum: 100% pole length projected downward
Extended: 161.8% Fibonacci extension
Failure Signs
❌ Breakdown on weak volume
❌ Pennant exceeds 20 periods
❌ Price re-enters pennant formation
Pro Tip: "Bearish pennants often lead to accelerated declines – watch for breakdowns during market weakness."
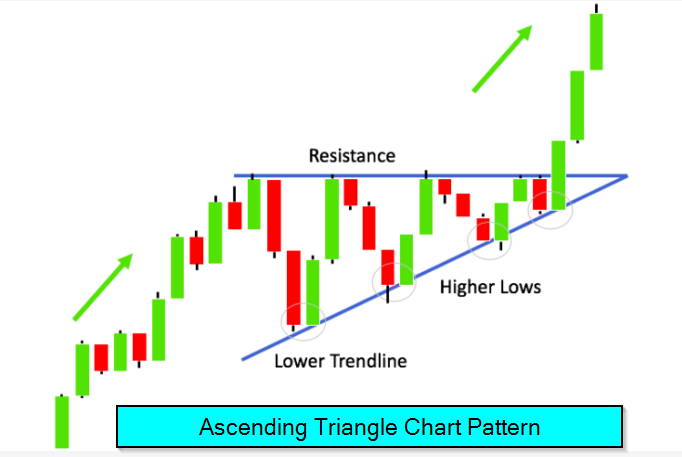
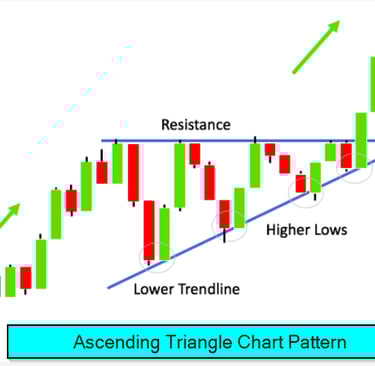

Ascending Triangle Pattern – Bullish Breakout Setup
Pattern Structure
✅ Upper Resistance: Multiple equal highs forming flat top
✅ Ascending Support: Rising trendline connecting higher lows
✅ Breakout: Decisive close above resistance
Key Confirmation Signals
🔹 Volume decreases during consolidation
🔹 Strong volume surge on breakout (3x average)
🔹 RSI maintains bullish structure (40+ during pullbacks)
Optimal Trading Plan
✔ Entry Triggers:
First close above resistance (aggressive)
Retest of breakout level (conservative)
✔ Stop Placement:
Below most recent higher low
OR below ascending trendline
✔ Profit Targets:
Minimum: Triangle height projected upward
Extended: 161.8% Fibonacci extension
Failure Warning Signs
❌ False breakout with immediate rejection
❌ Volume declines on breakout attempt
❌ Breakdown below ascending support
Pro Tip: "Ascending triangles have 75% success rate when breaking out in uptrends – the longer the consolidation (8+ weeks), the stronger the breakout."
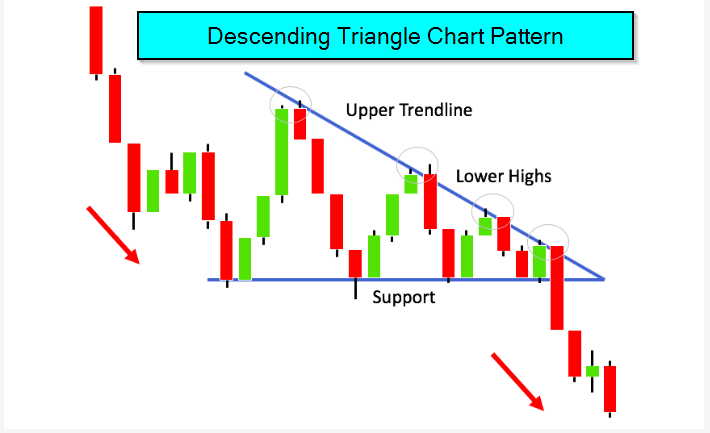
Descending Triangle Pattern – Bearish Breakdown Setup
Pattern Structure
✅ Lower Support: Multiple equal lows forming flat bottom
✅ Descending Resistance: Lowering trendline connecting lower highs
✅ Breakdown: Decisive close below support
Key Confirmation Signals
🔹 Volume decreases during consolidation
🔹 Strong volume surge on breakdown (3x average)
🔹 RSI maintains bearish structure (below 60 during bounces)
Optimal Trading Plan
✔ Entry Triggers:
First close below support (aggressive)
Retest of breakdown level (conservative)
✔ Stop Placement:
Above most recent lower high
OR above descending trendline
✔ Profit Targets:
Minimum: Triangle height projected downward
Extended: 161.8% Fibonacci extension
Failure Warning Signs
❌ False breakdown with immediate recovery
❌ Volume declines on breakdown attempt
❌ Breakout above descending resistance
Pro Tip: "Descending triangles have 68% success rate in downtrends – Watch for breakdowns during market weakness for highest probability trades."
Bull/Bear Flag Chart Patterns-Most Common Continuation Patterns
Forms frequently in trending stocks (momentum plays)
Provides low-risk entries with tight stops
Works on 1-minute to 15-minute charts
Key Setup:
Sharp move (flagpole) → Shallow pullback (flag) → Breakout in trend direction
Double Top / Double Bottom (Reliable Reversal Pattern)
-Easy to spot on intraday charts
- High win rate when combined with volume spikes
-Often forms at key support/resistance levels
Key Setup:
Two failed attempts at a price level → Break of neckline (confirmation)
Head and Shoulder Pattern/Inverse Head and Shoulder
Head and Shoulders (Inverse H&S) (Trend Reversal King)
High reliability in intraday reversals
Clear stop-loss level (above right shoulder)
Works well with RSI divergence
Key Setup:
Left shoulder → Lower head → Higher right shoulder → Neckline break
Pennants Bullish/Bearish Chart Patterns
Pennant (Tight Consolidation for Explosive Moves)
Forms in high-volume stocks during pauses
Breakouts often lead to fast, scalping opportunities
Small risk (stop inside pennant), big reward
Key Setup:
Sharp move → Symmetrical tightening → Breakout continuation
Ascending / Descending Triangle (Breakout Favorite)
Predictable breakout direction (bullish/bearish bias)
Tight consolidation allows for precise entries
Common in pre-market setups for gap-and-go plays
Key Setup:
Flat top (resistance) + rising lows = Ascending Triangle (bullish)
Flat bottom (support) + lower highs = Descending Triangle (bearish)